5th SHU Management Science Project Exhibition Spring 2026

Quick Links
Project Overview
| 232 Unique Projects | 591 Evaluation Entries | 185 No. of Projects Evaluated Online | 47 No. of Projects Evaluated Manually | 102 External Evaluators |
Executive Summary
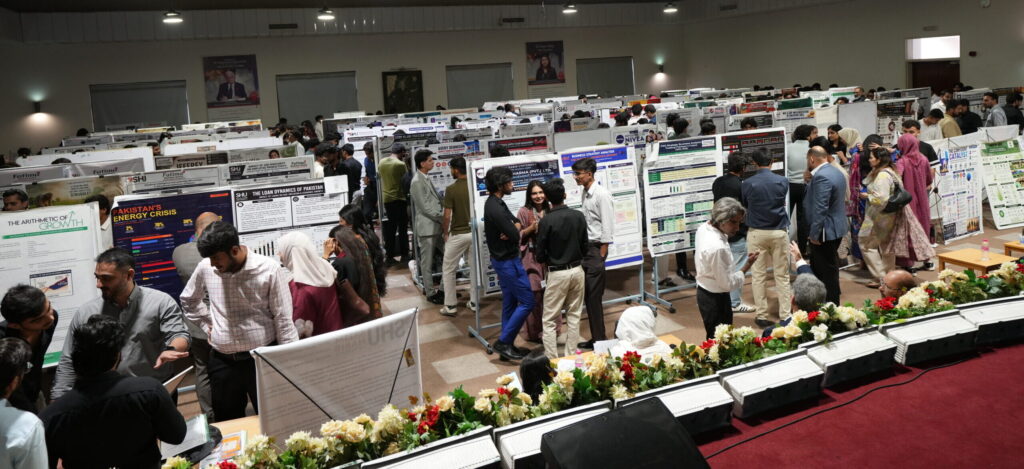
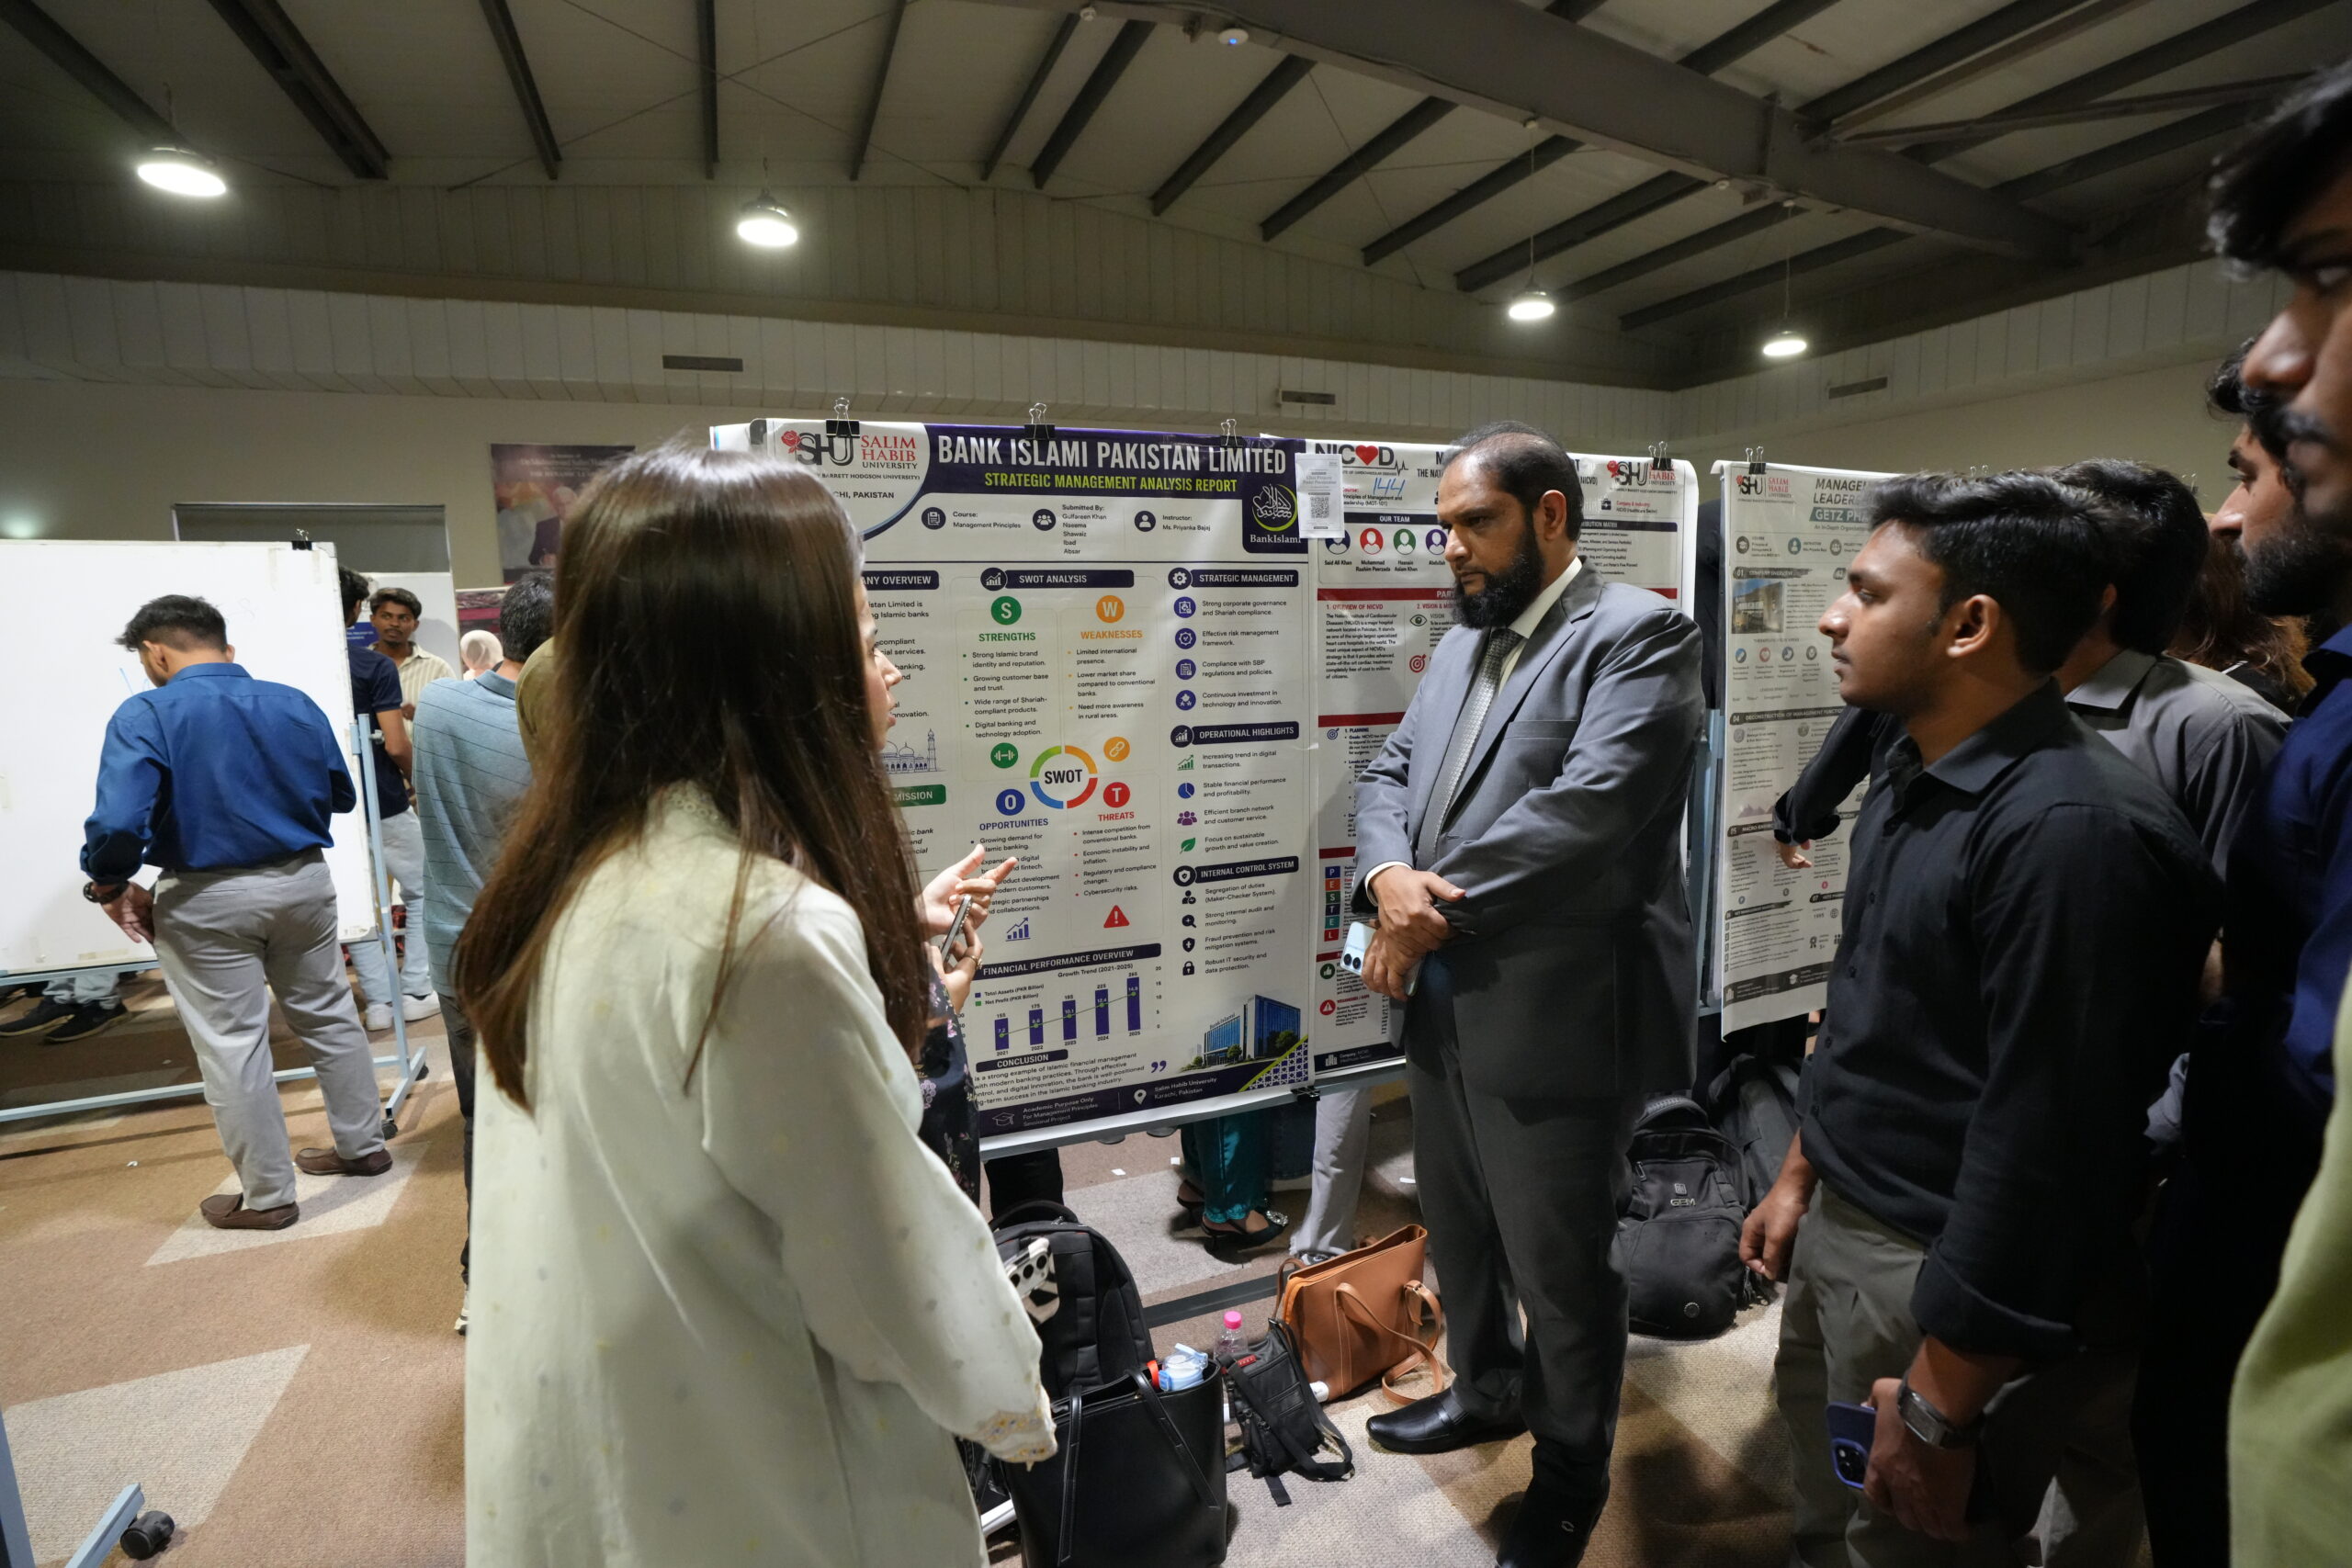
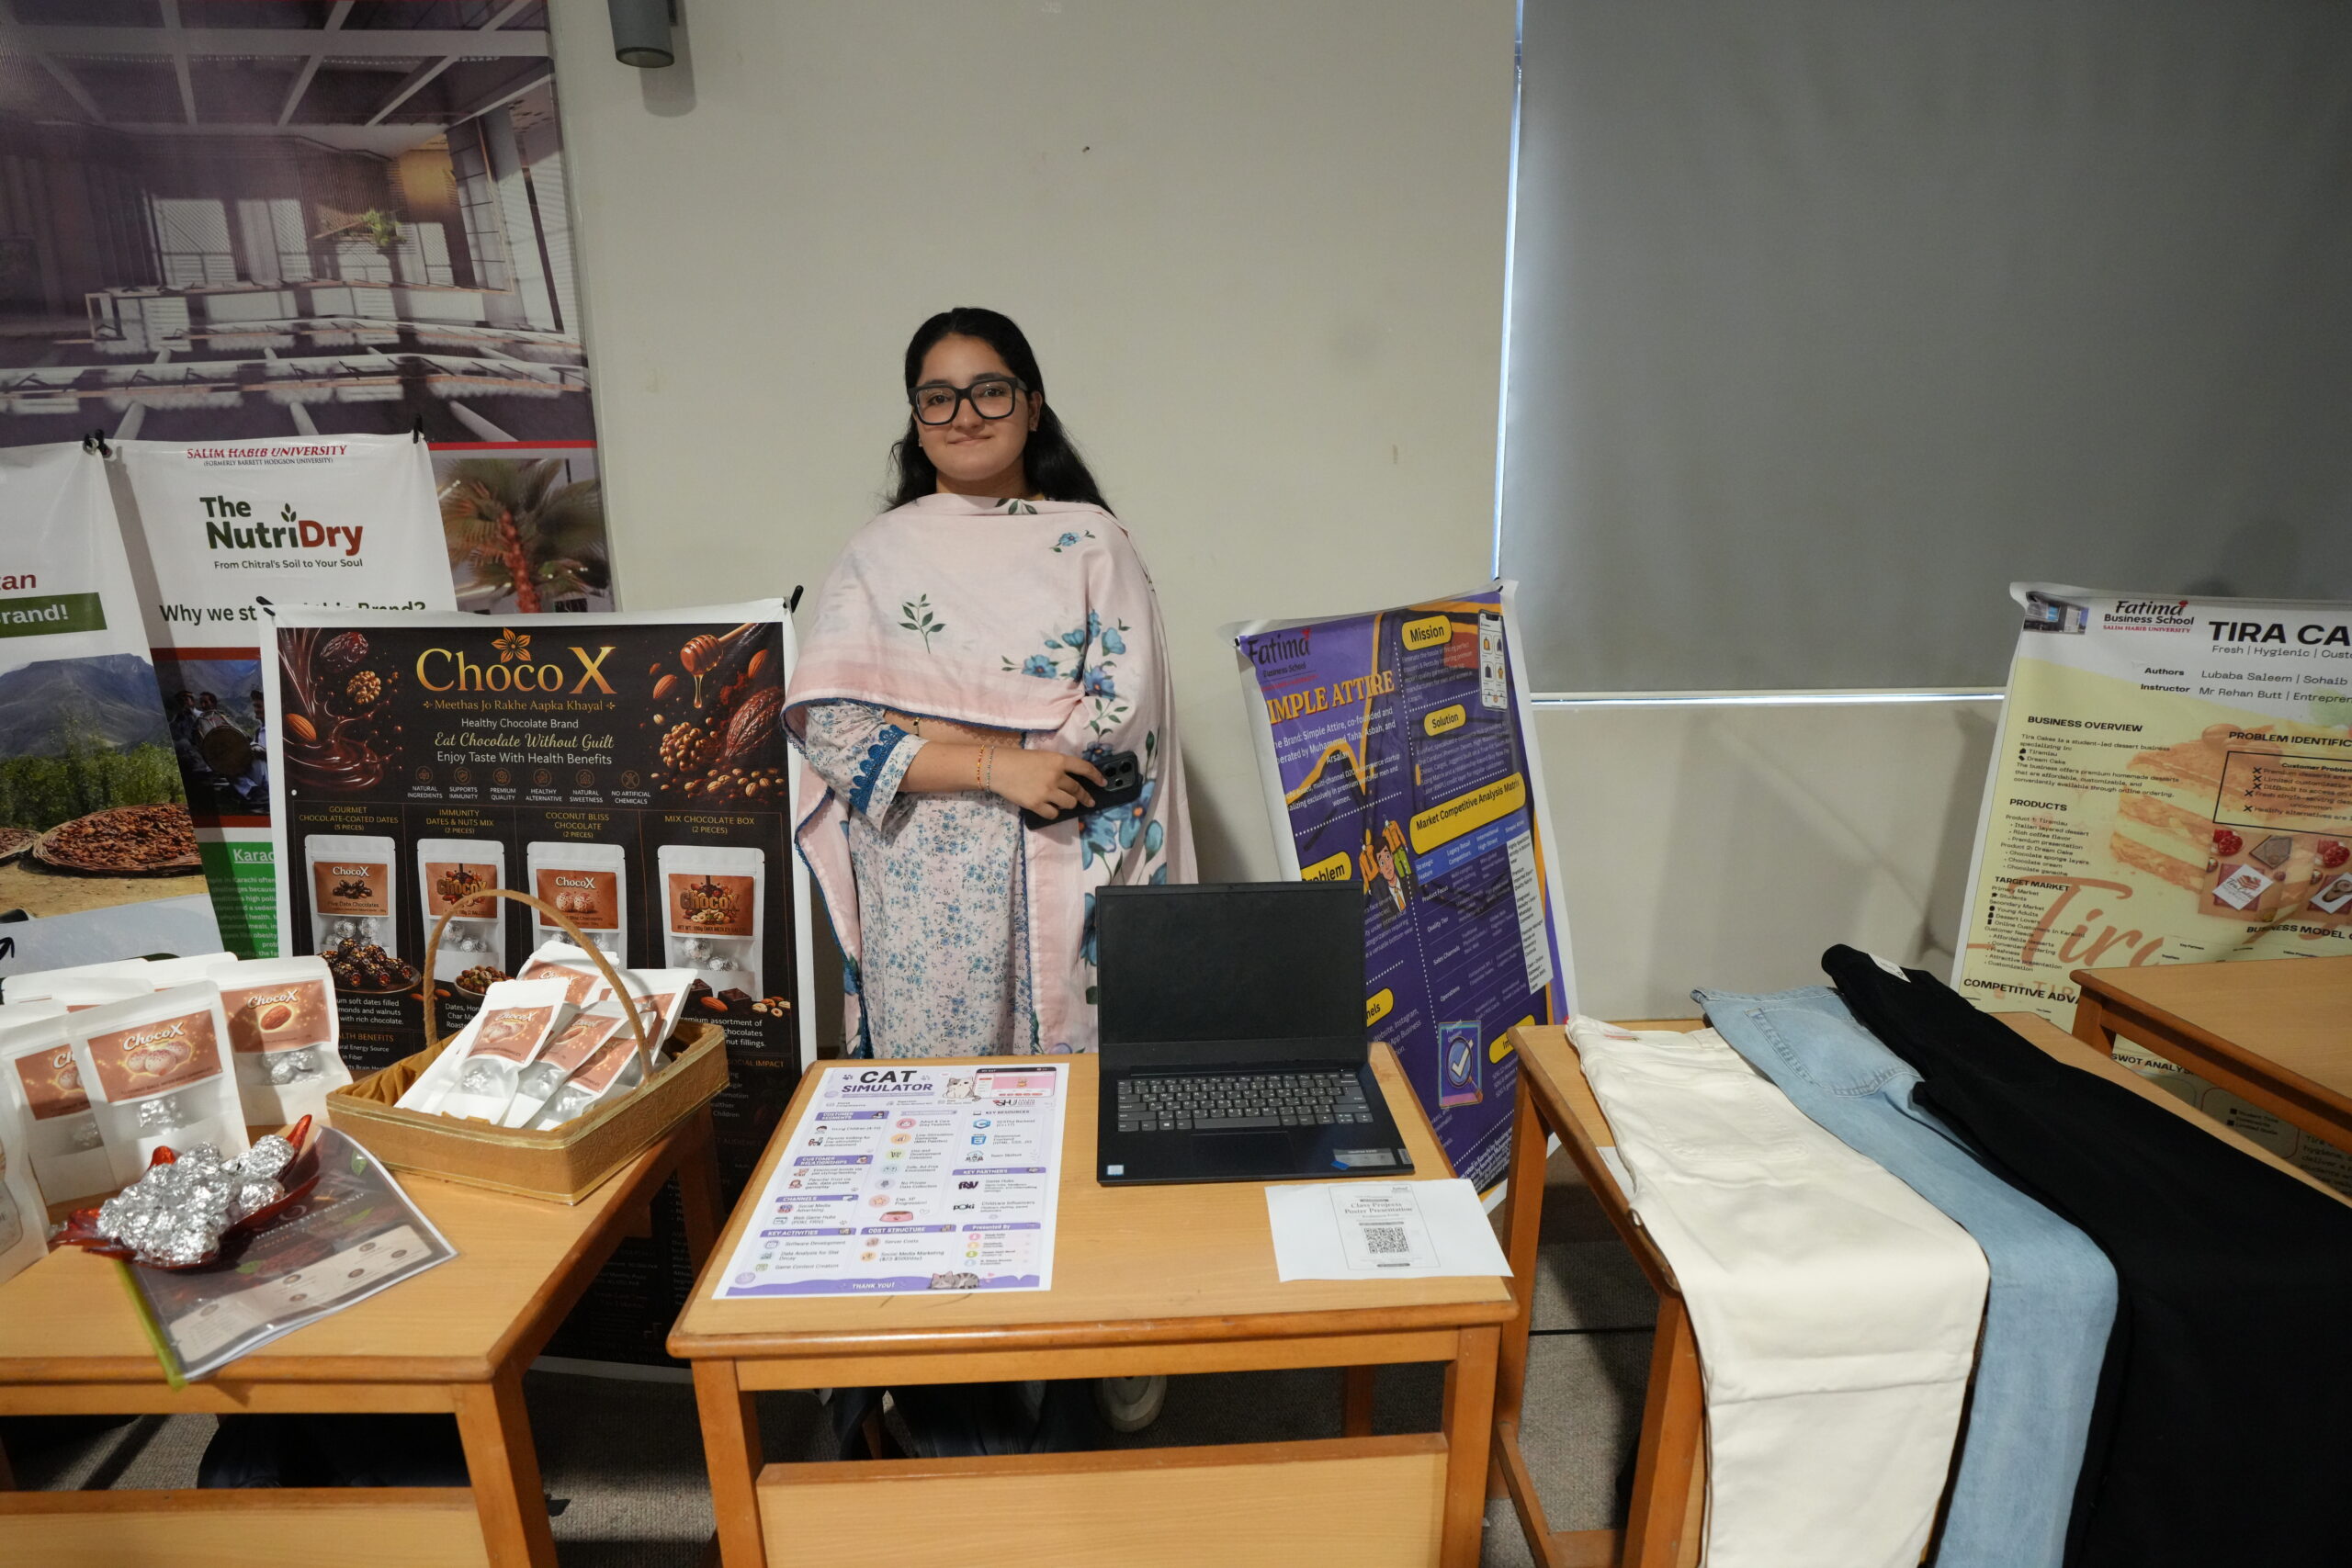
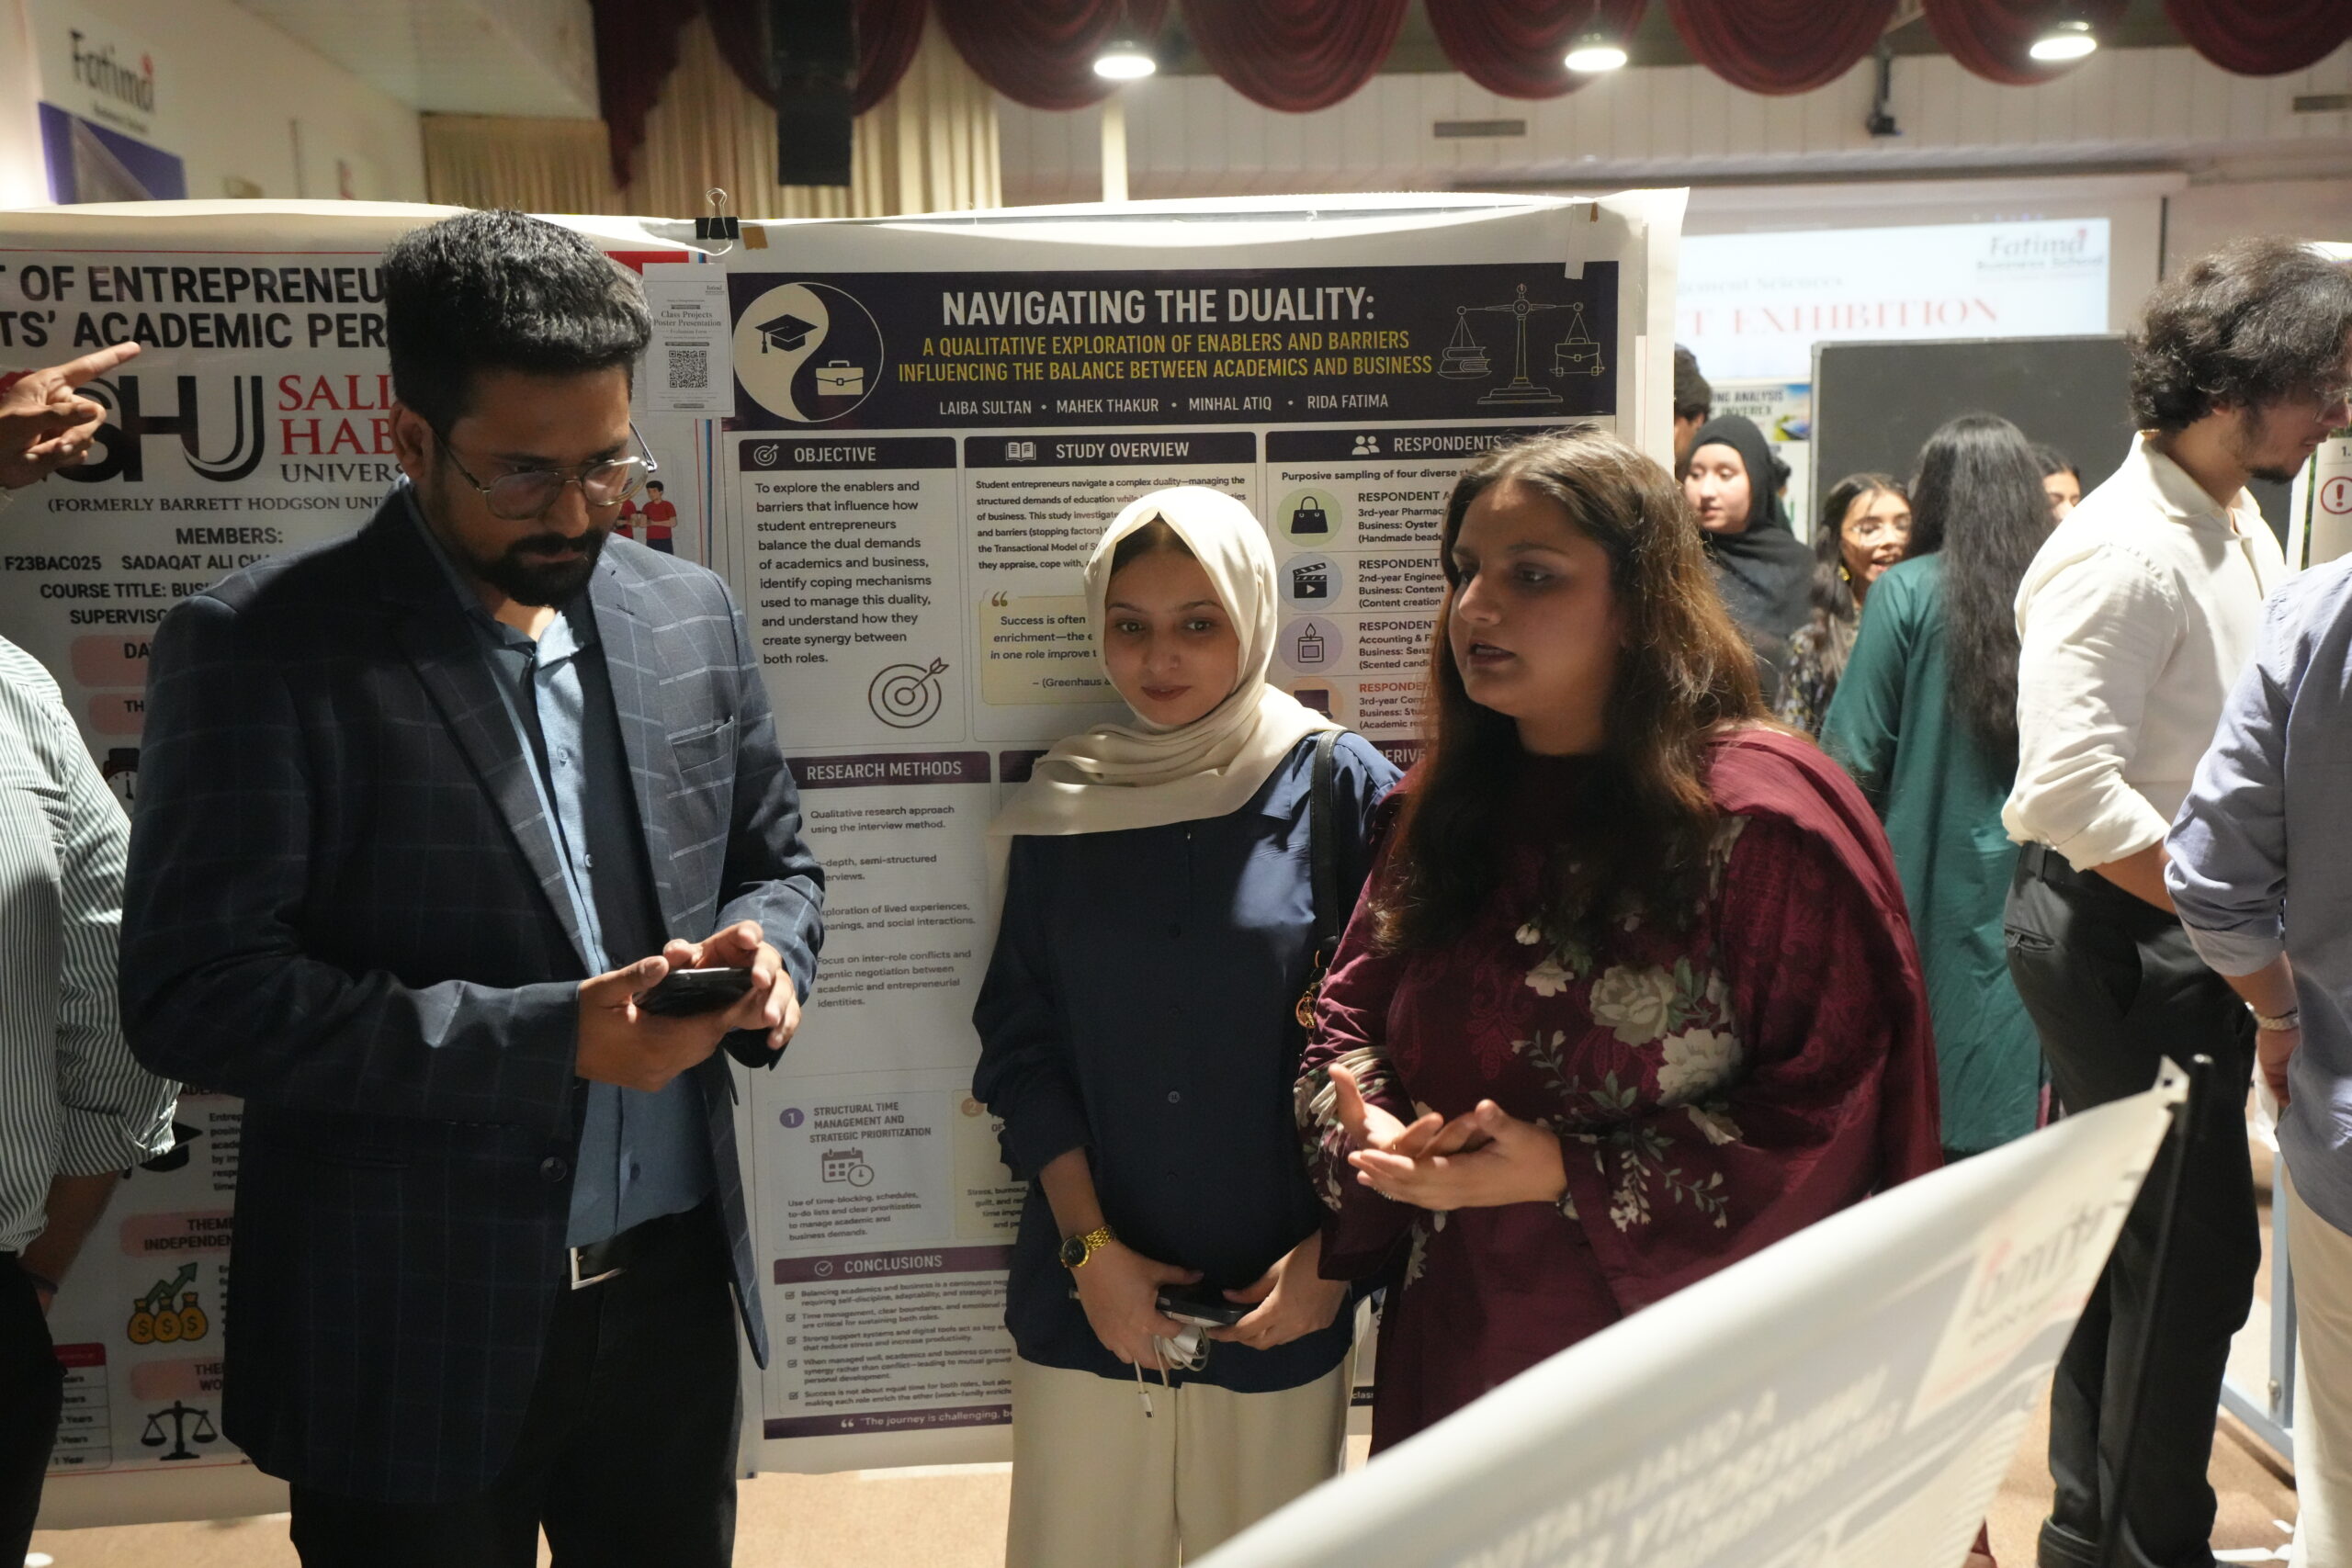
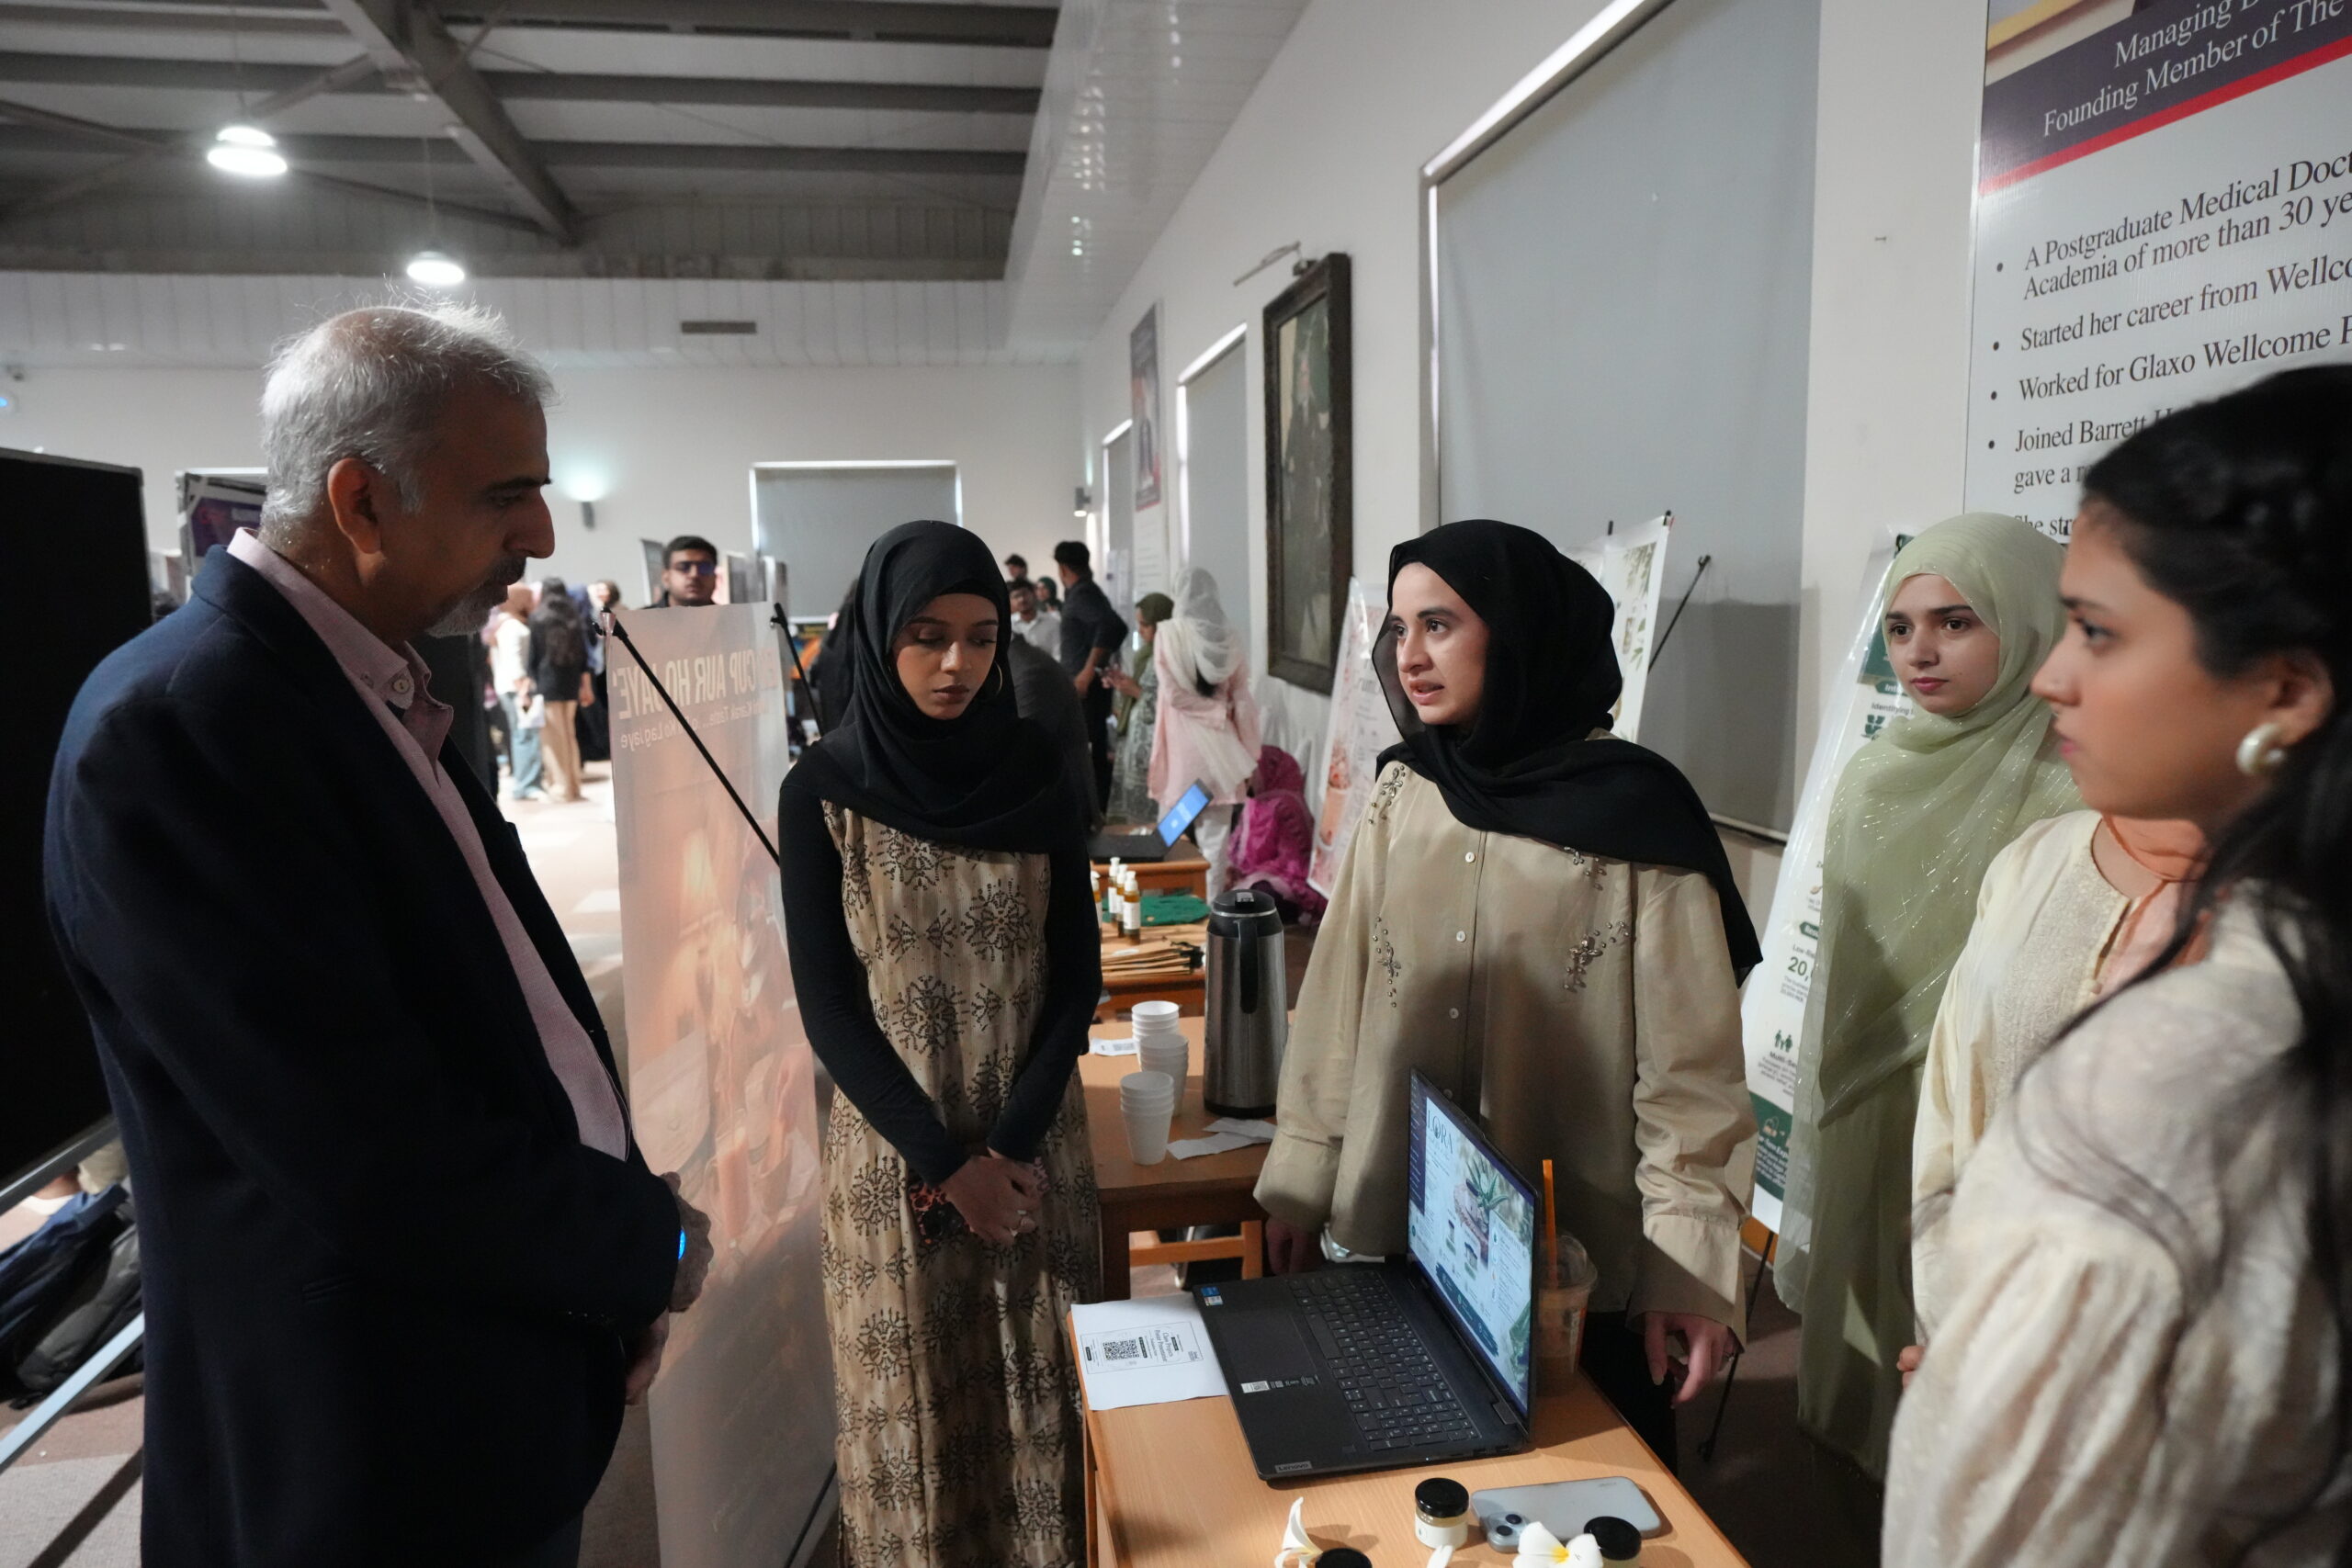
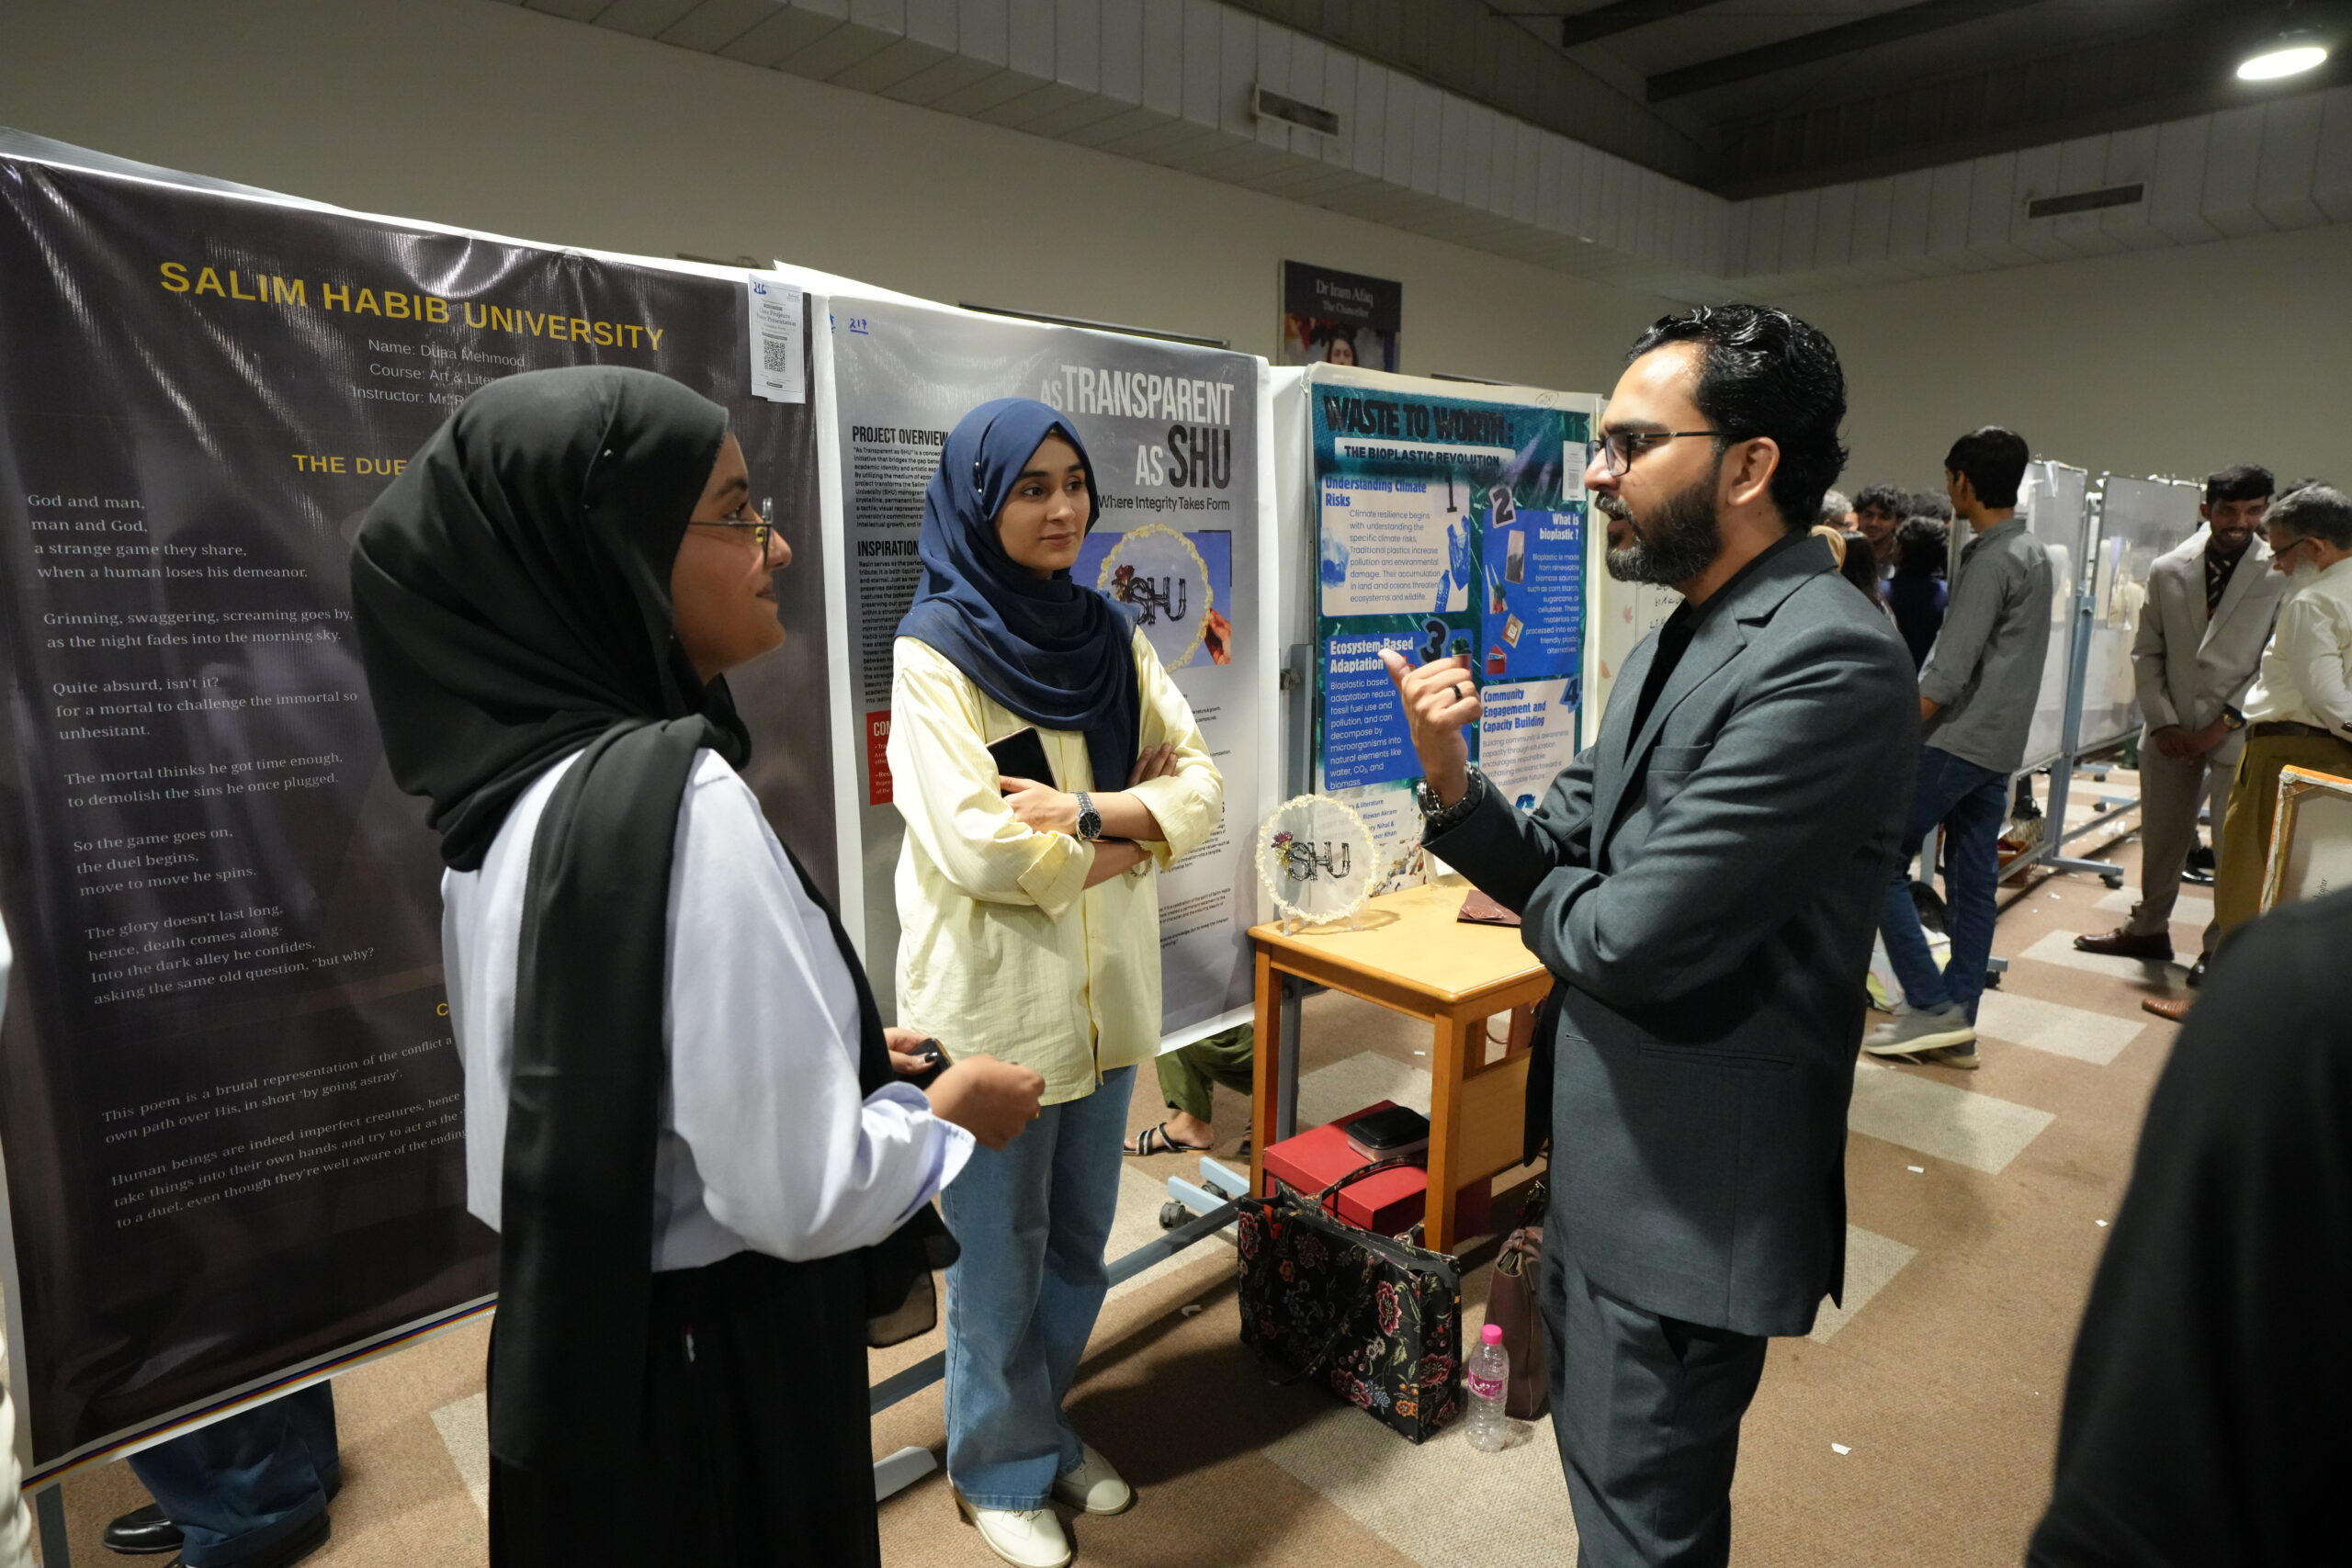
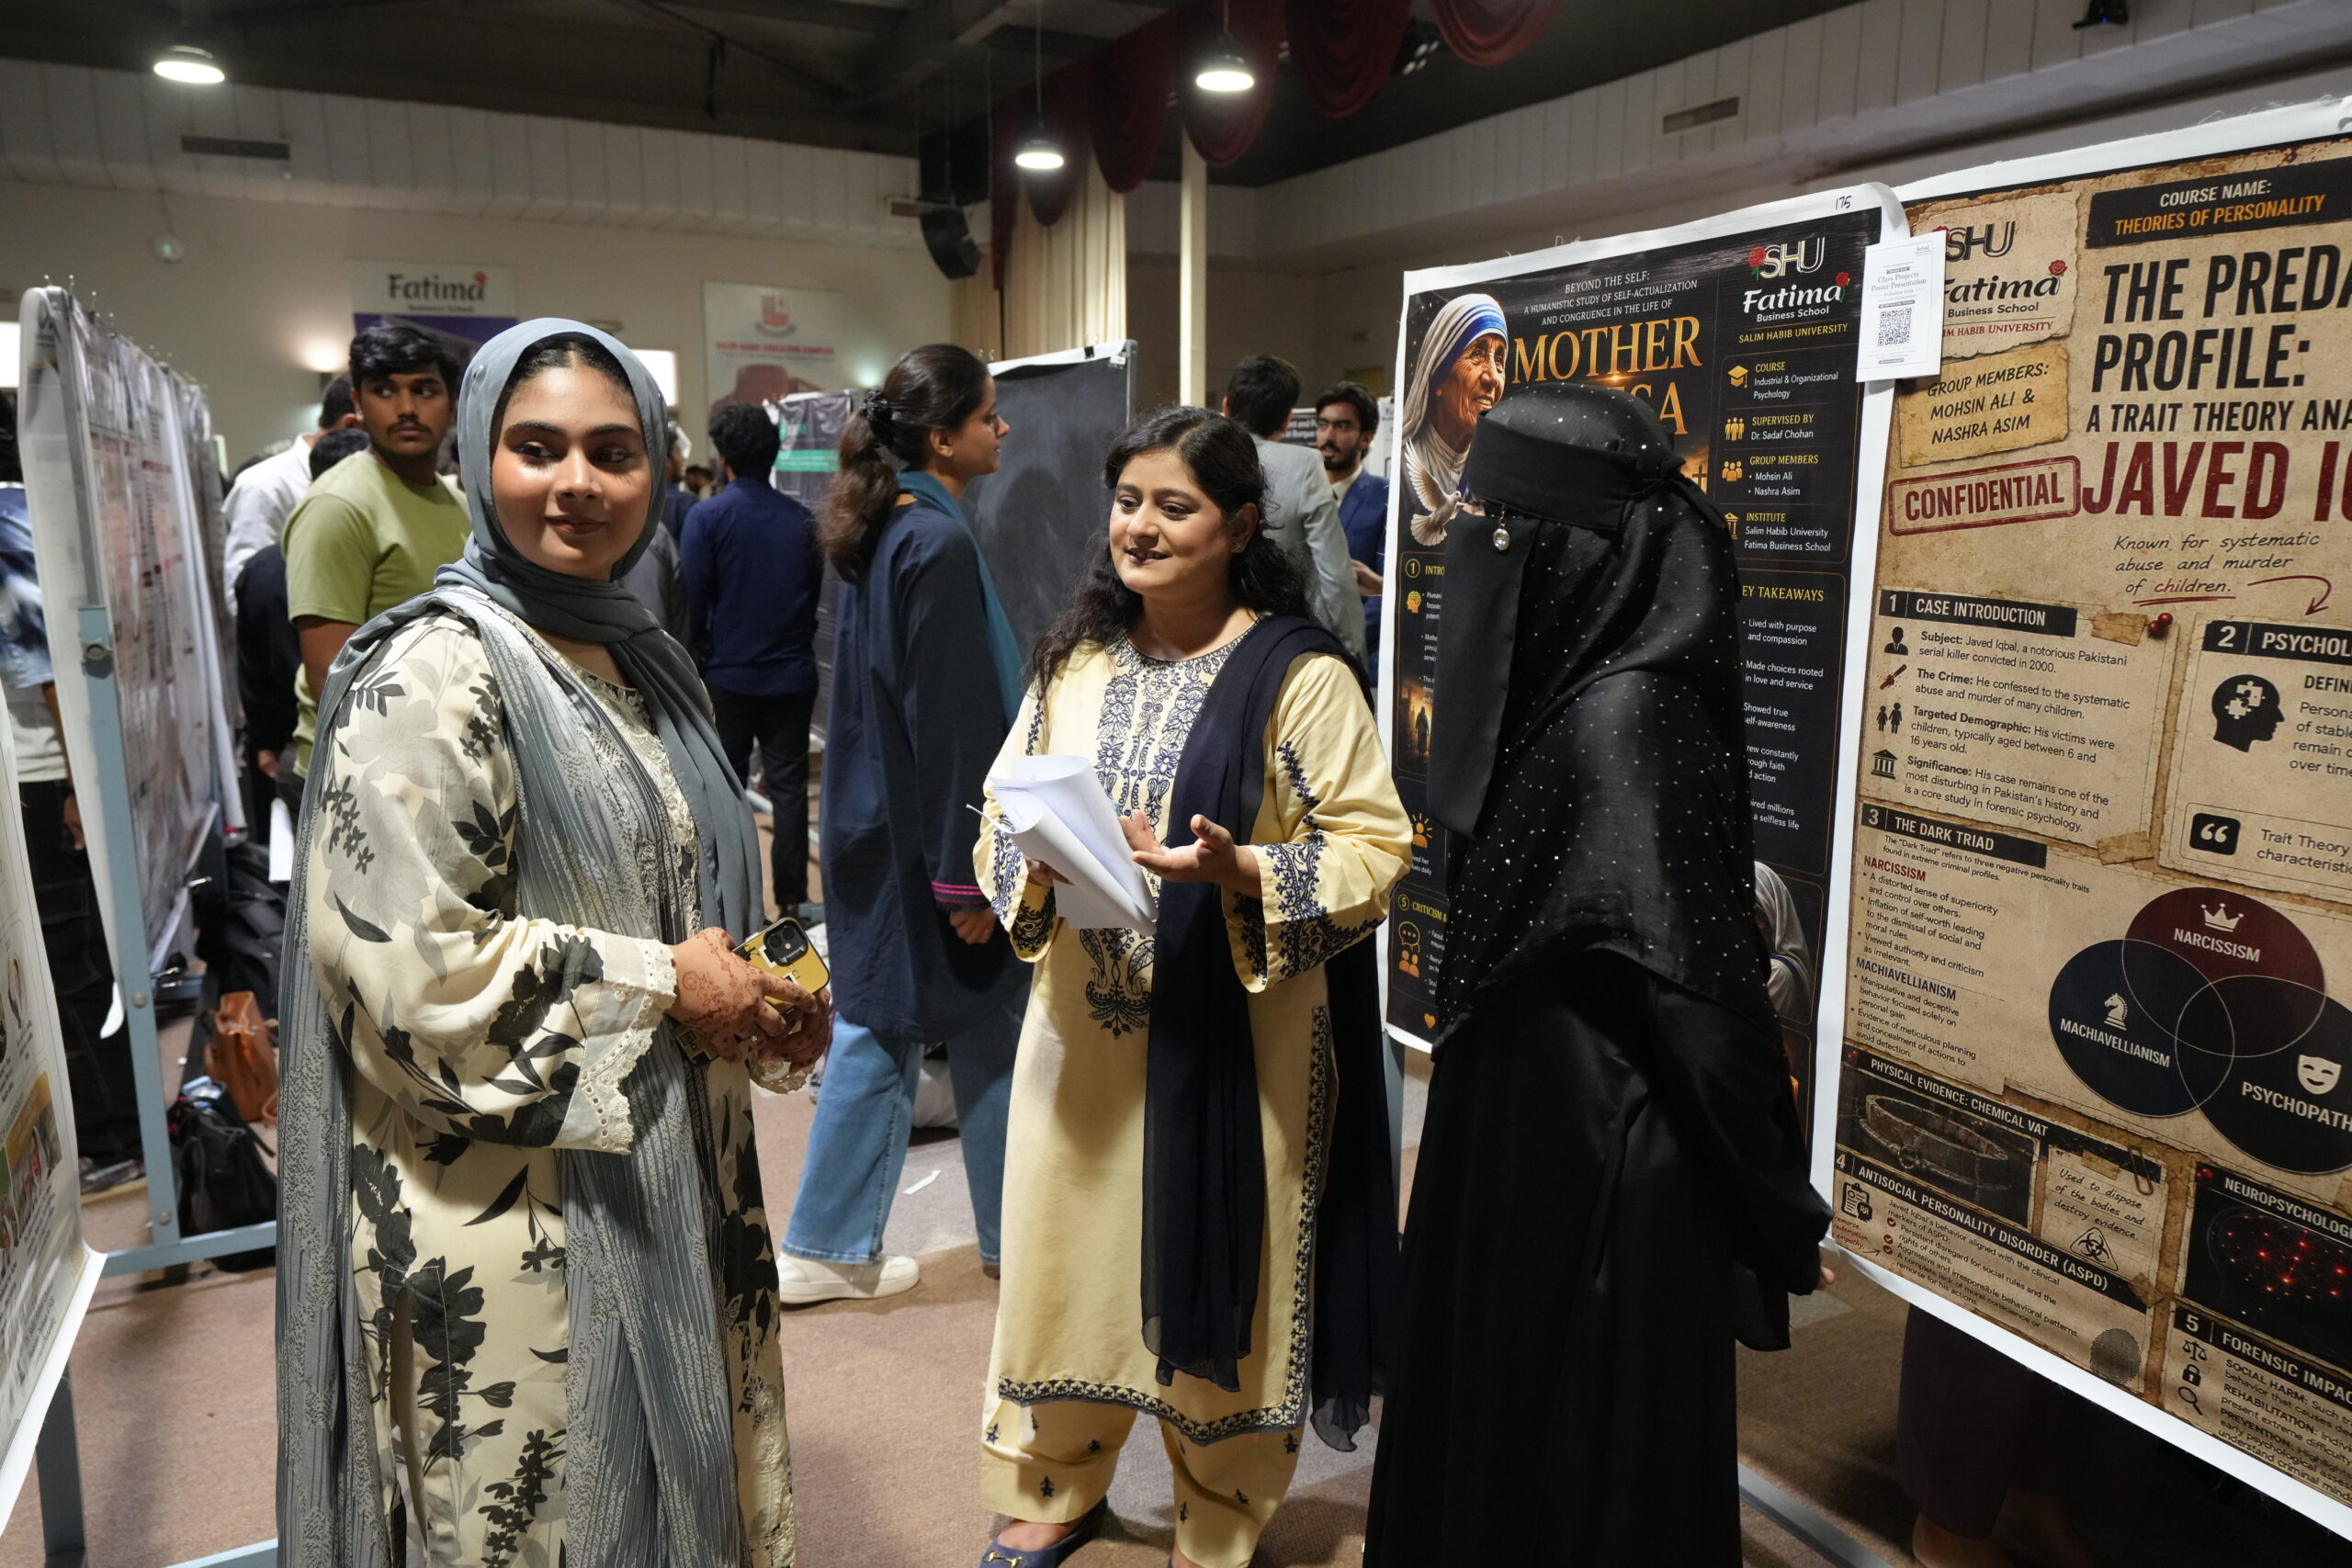
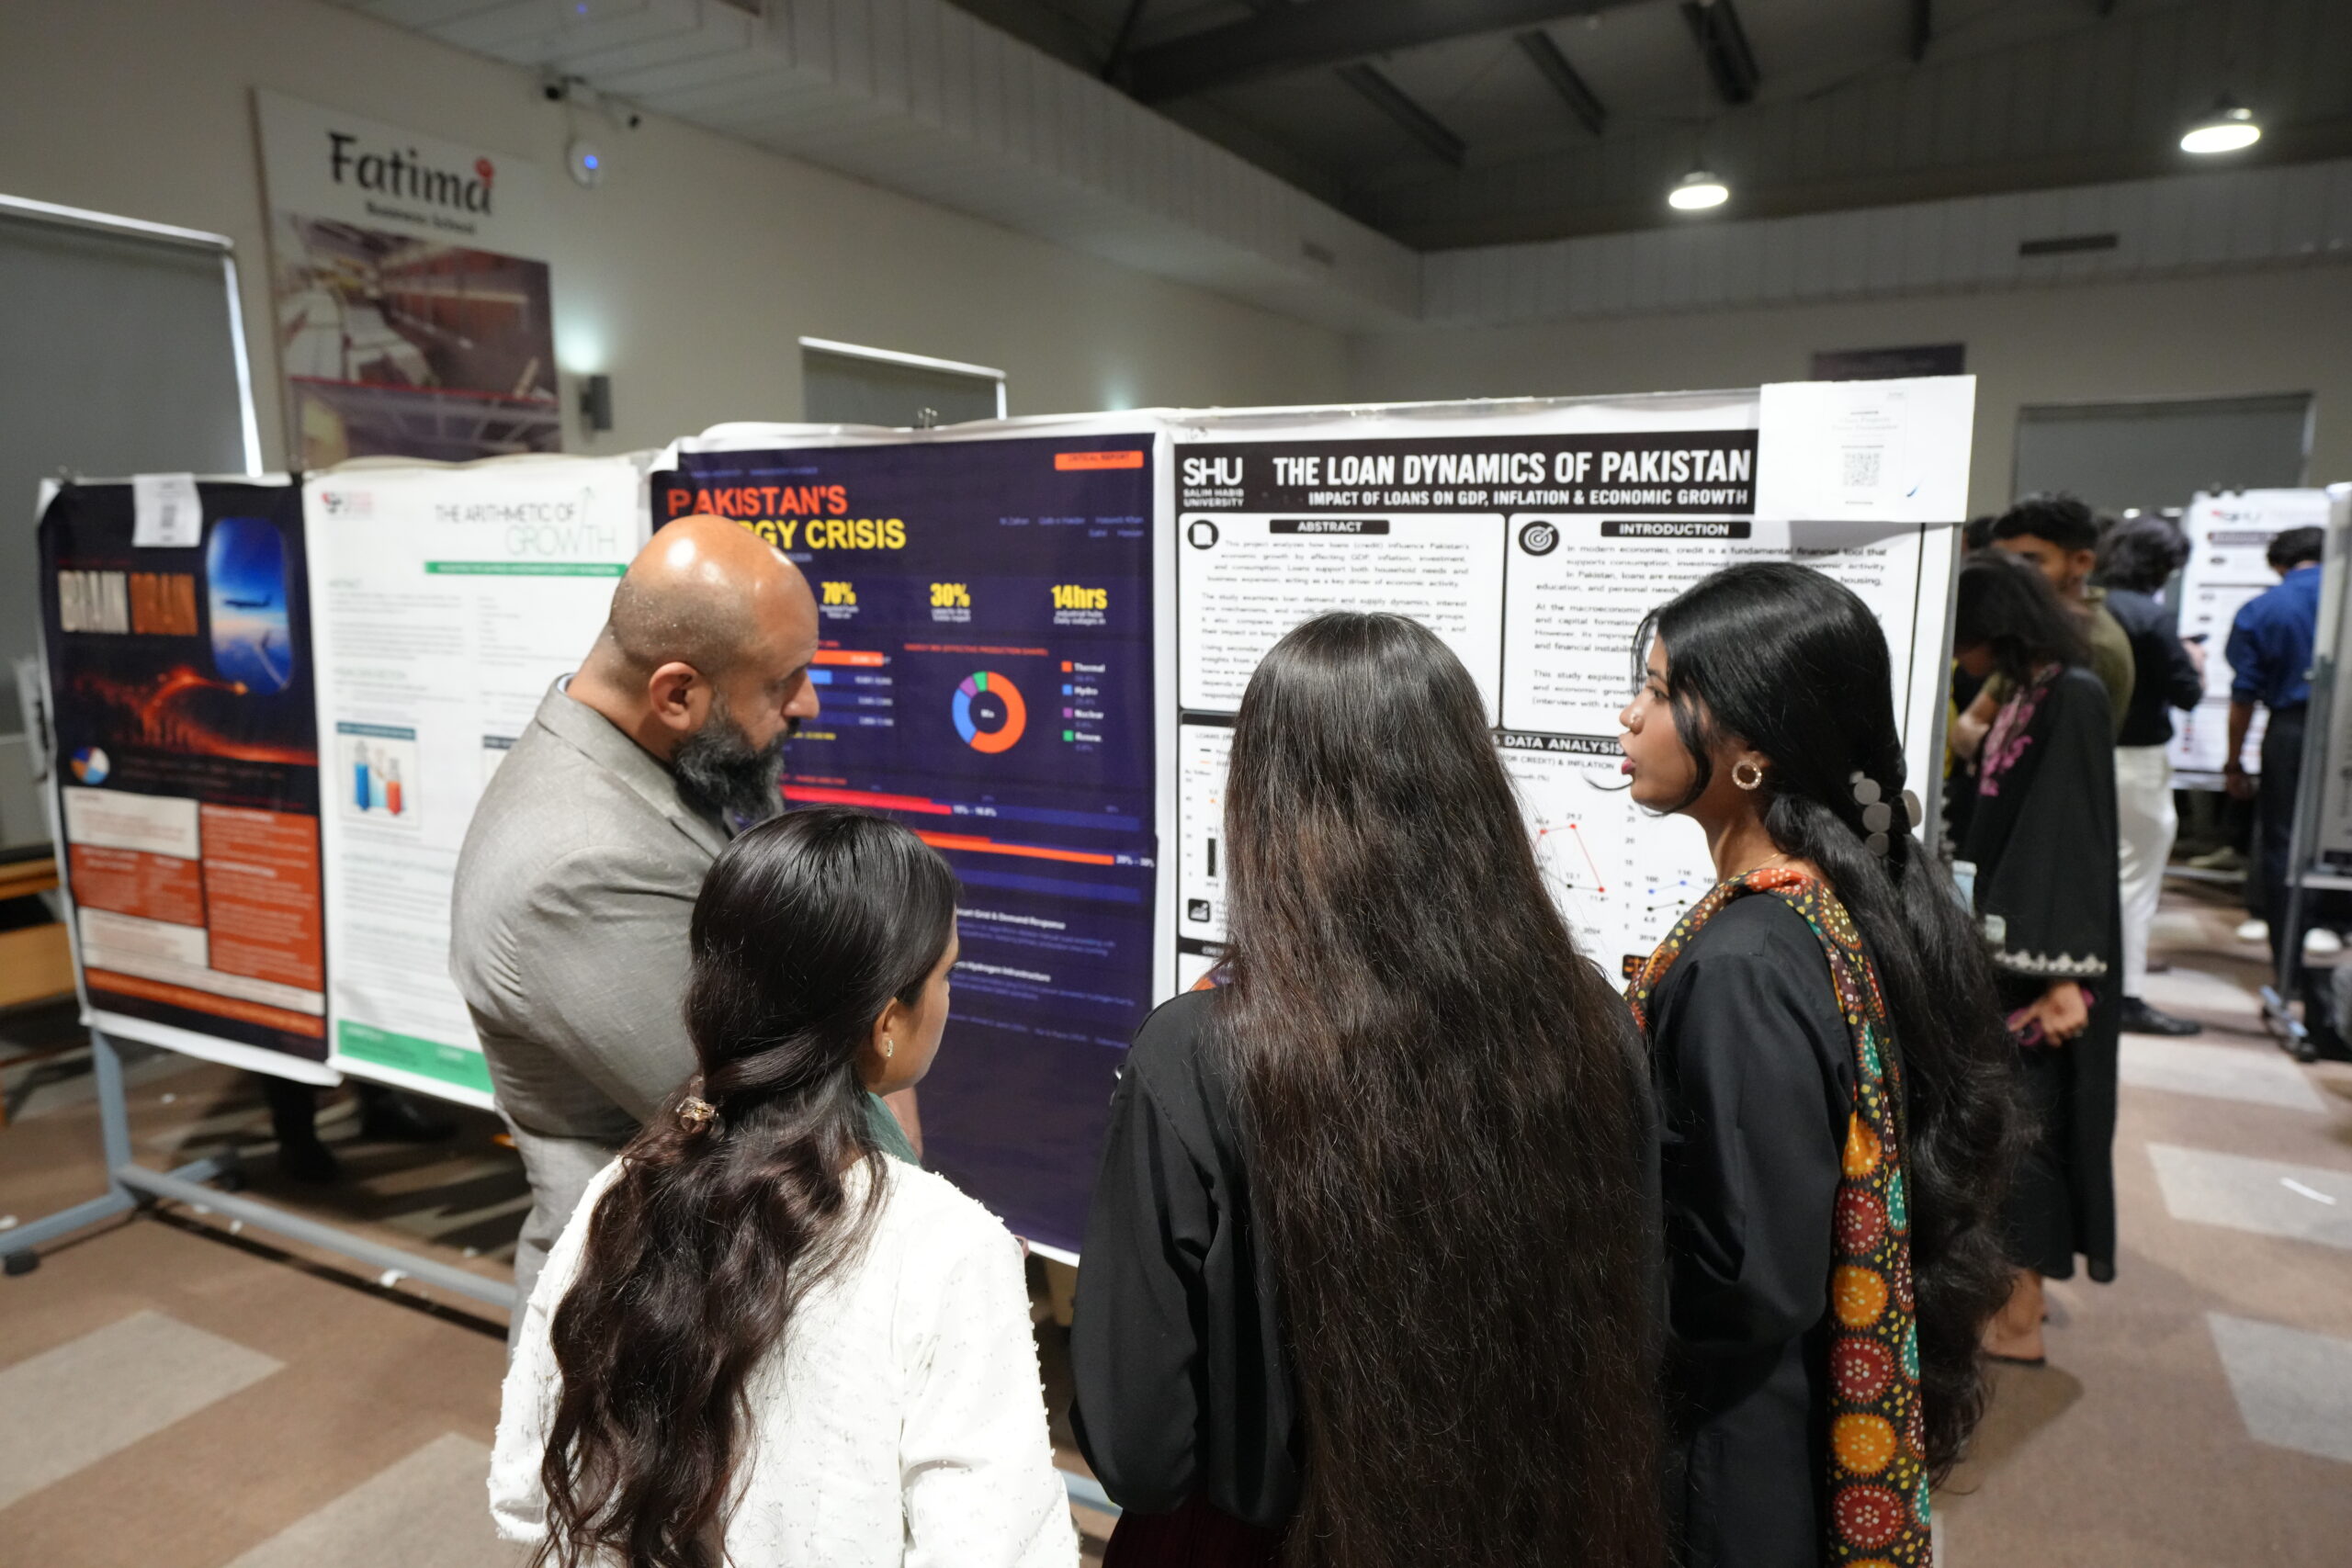
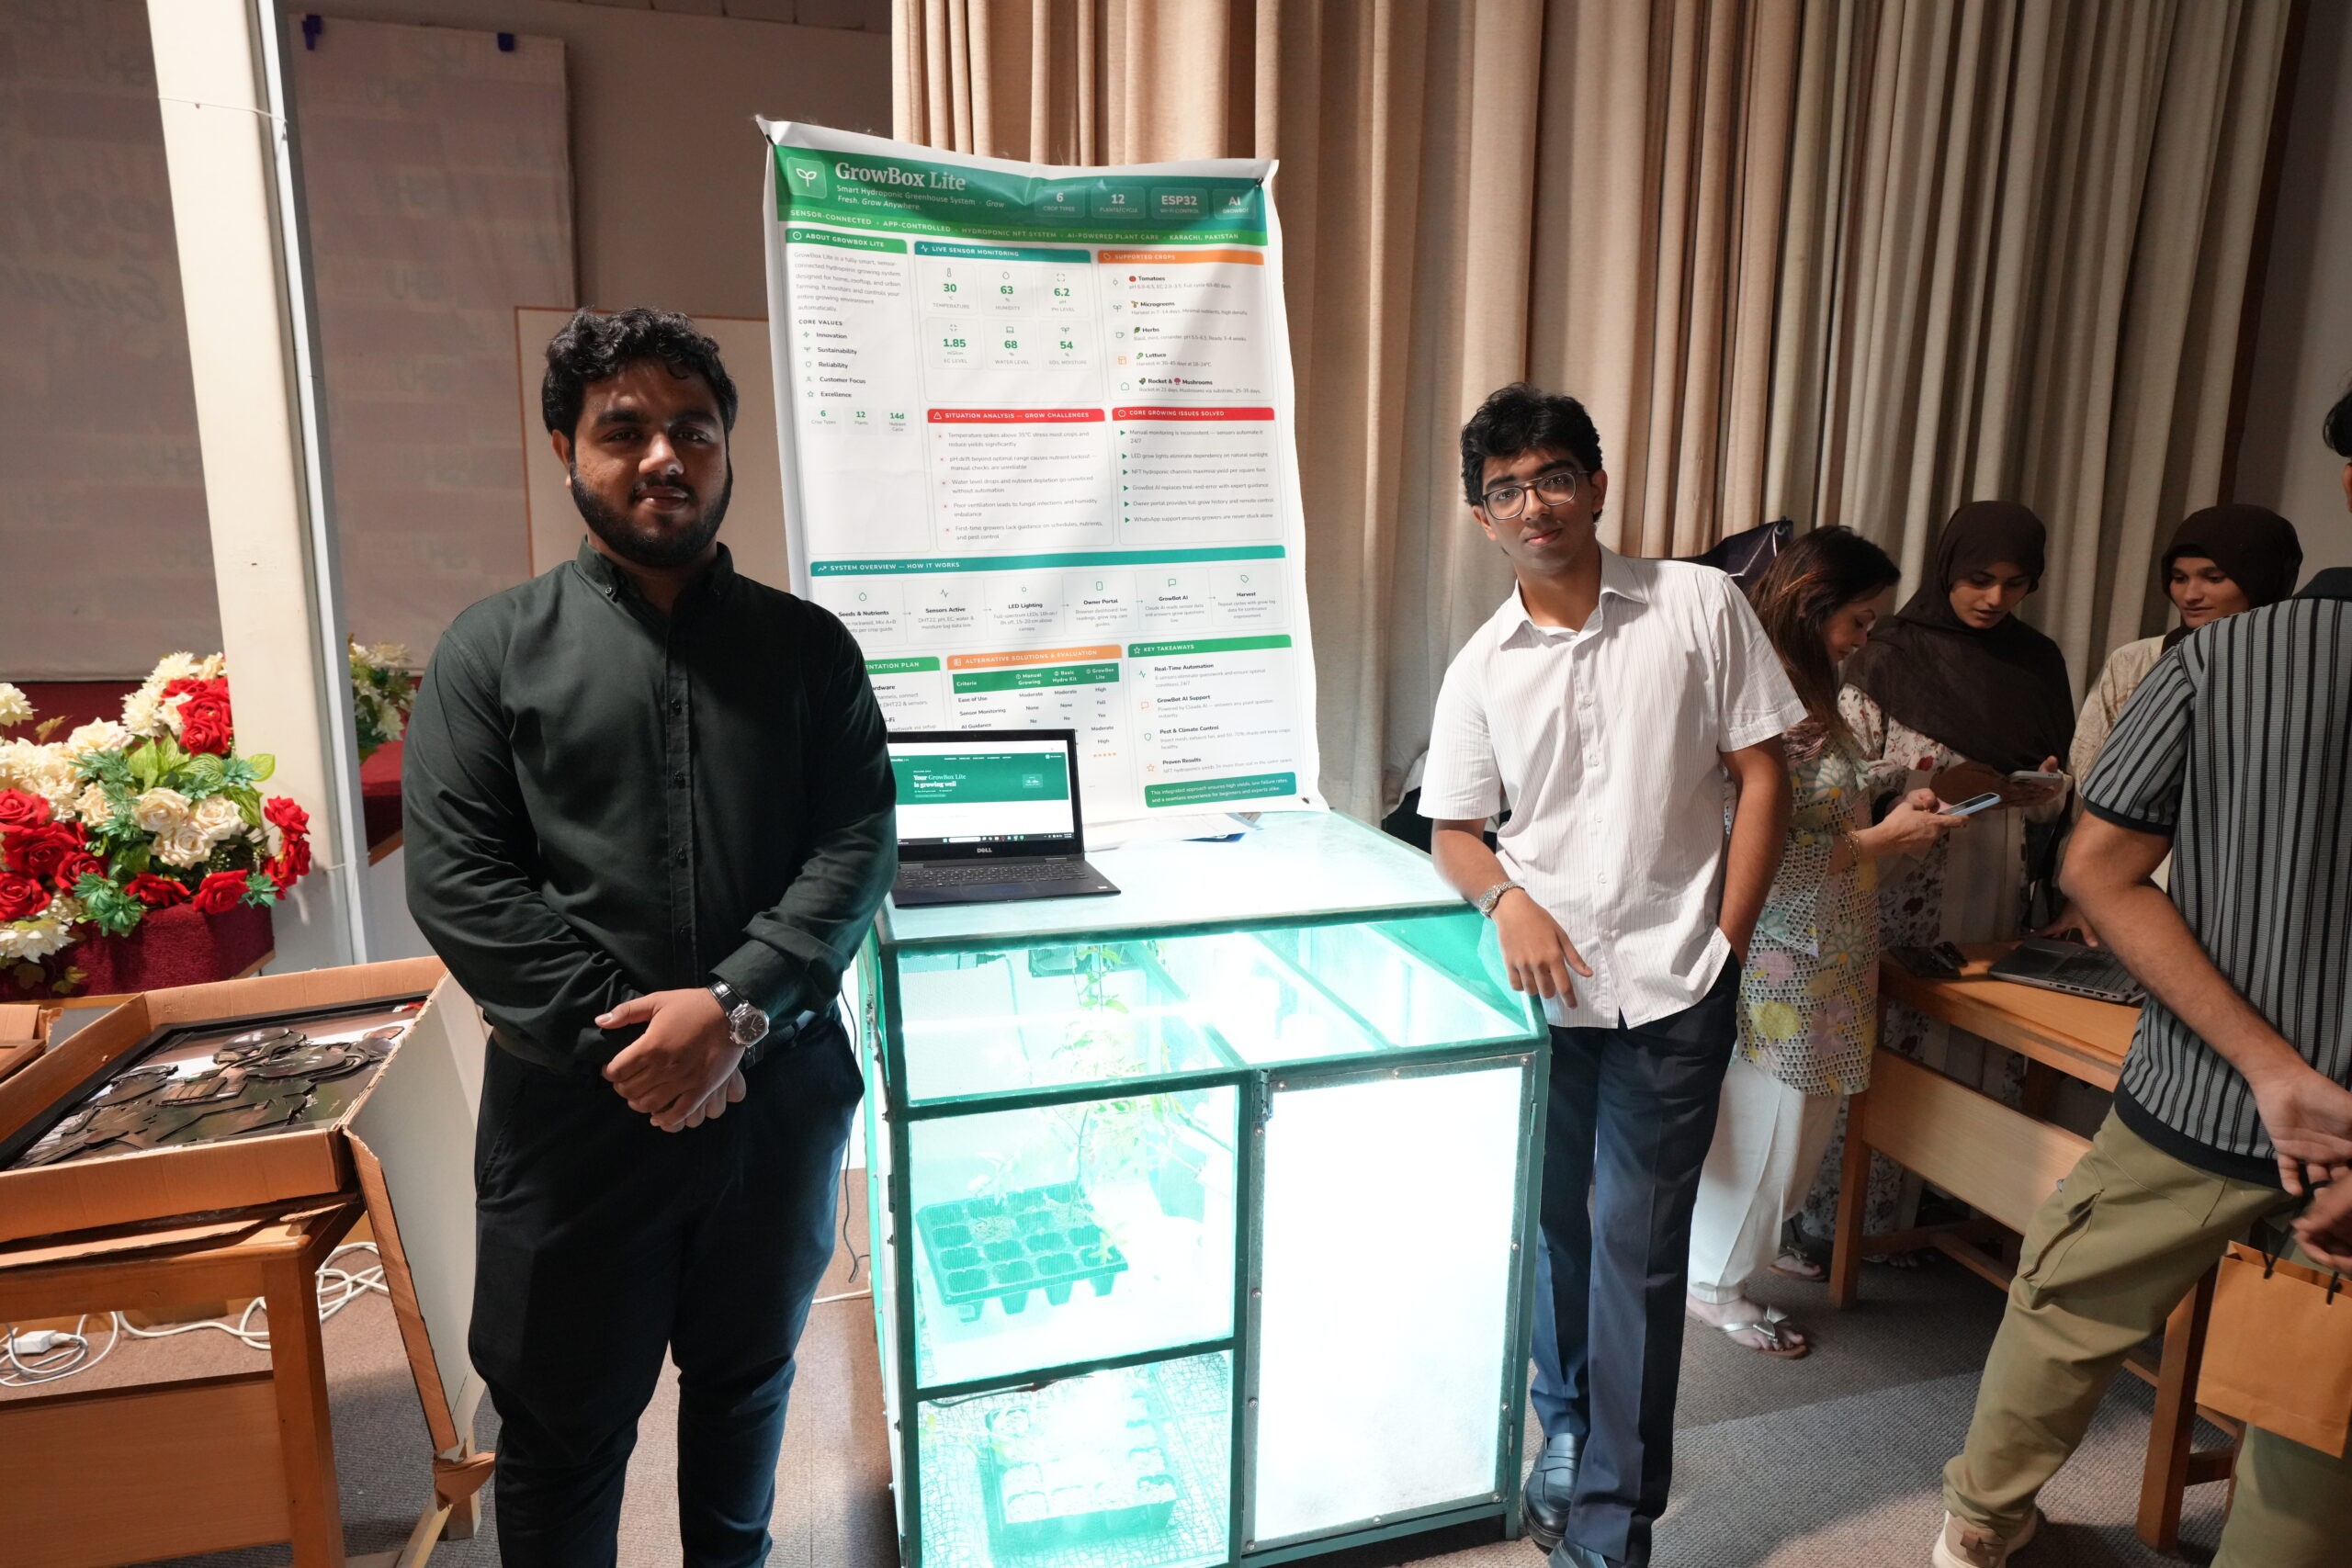
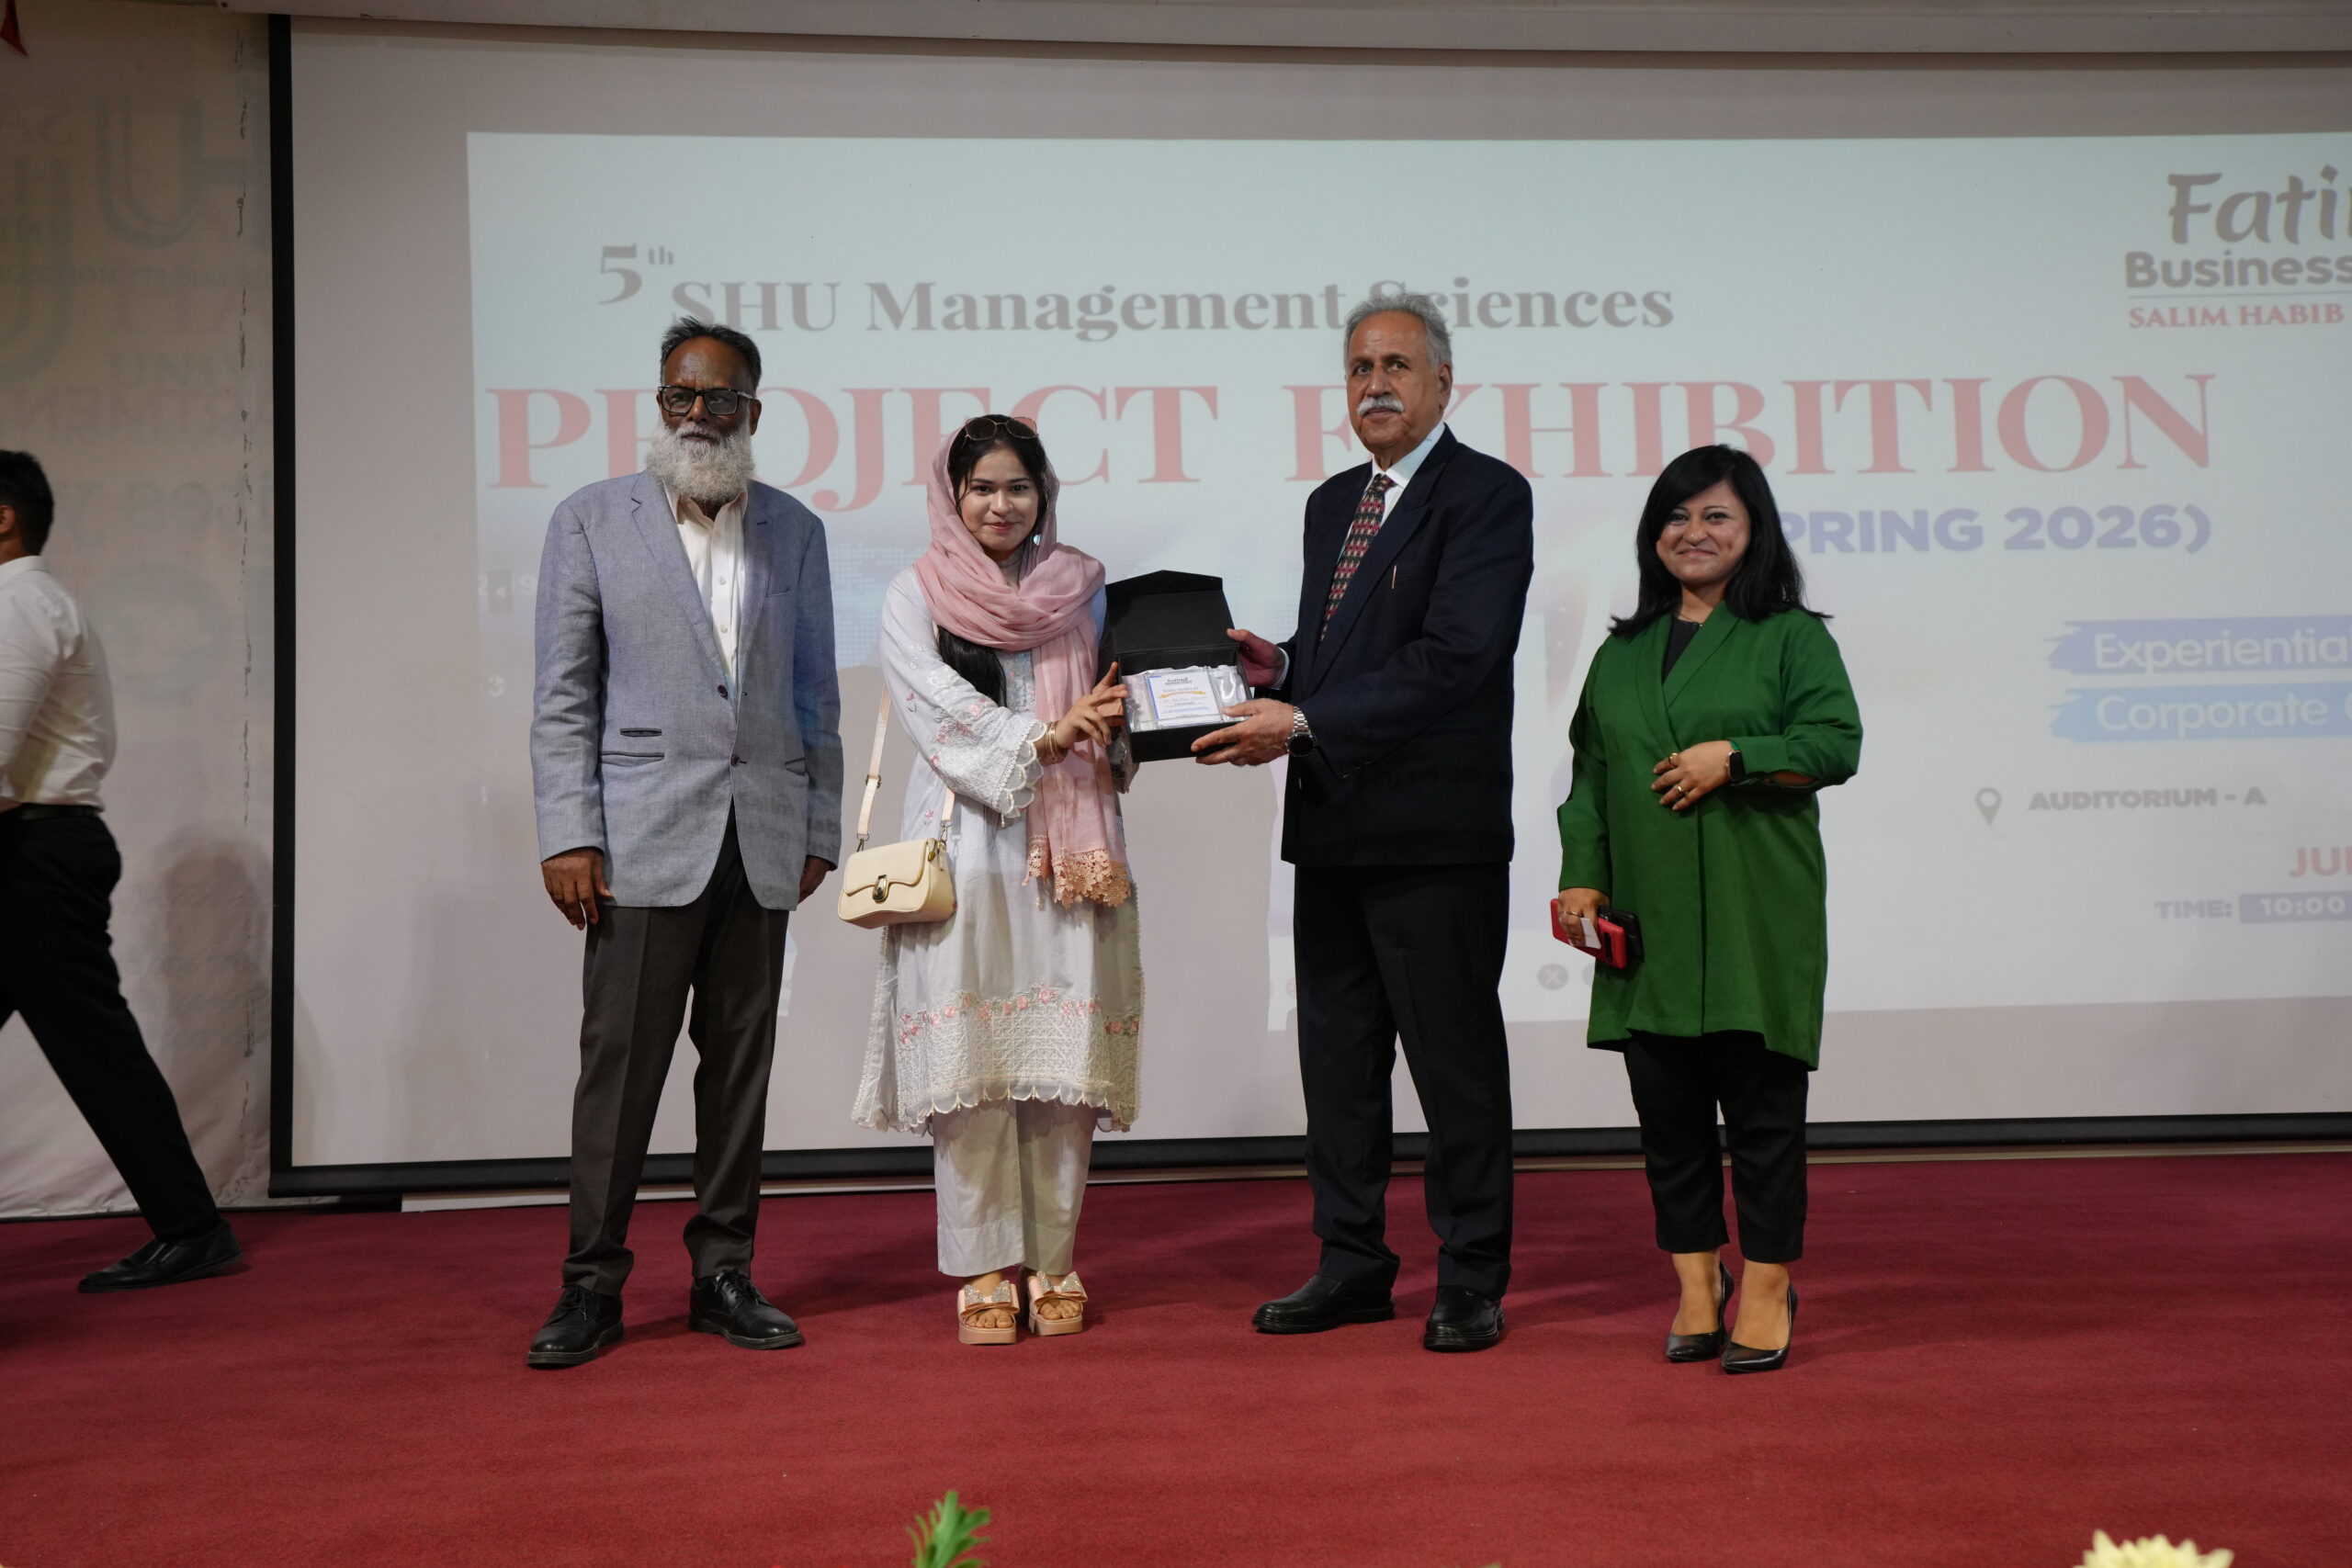
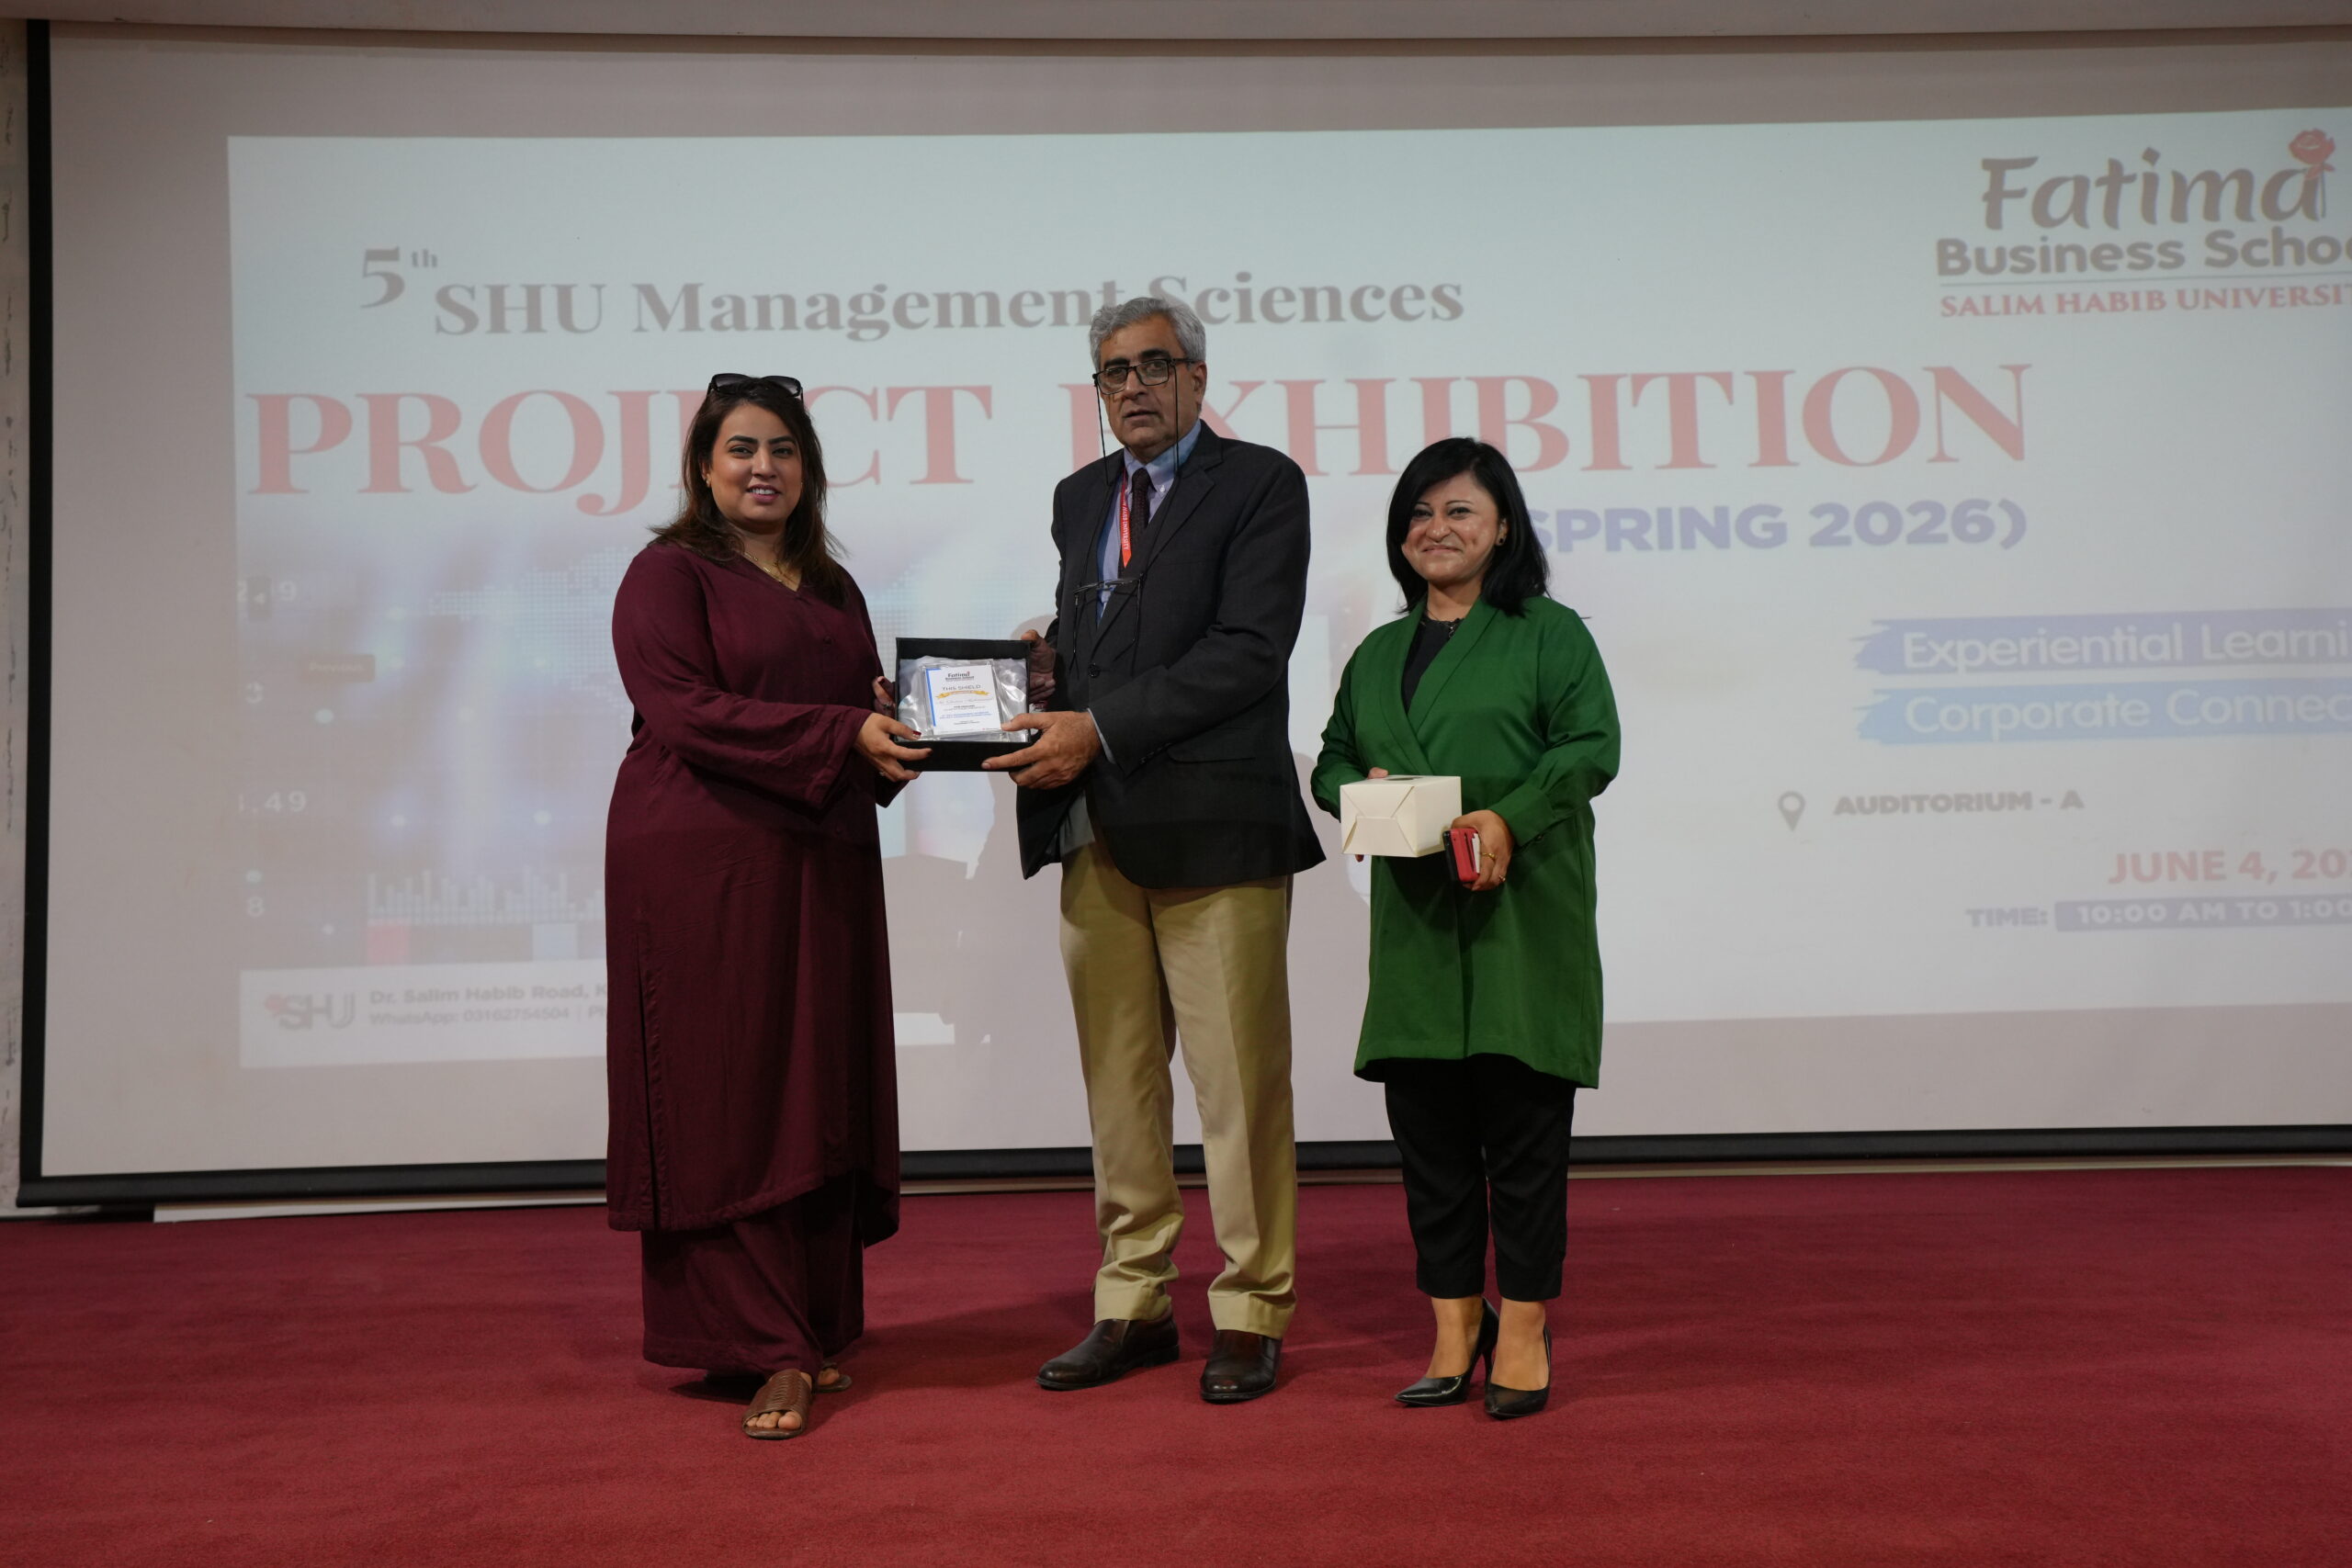
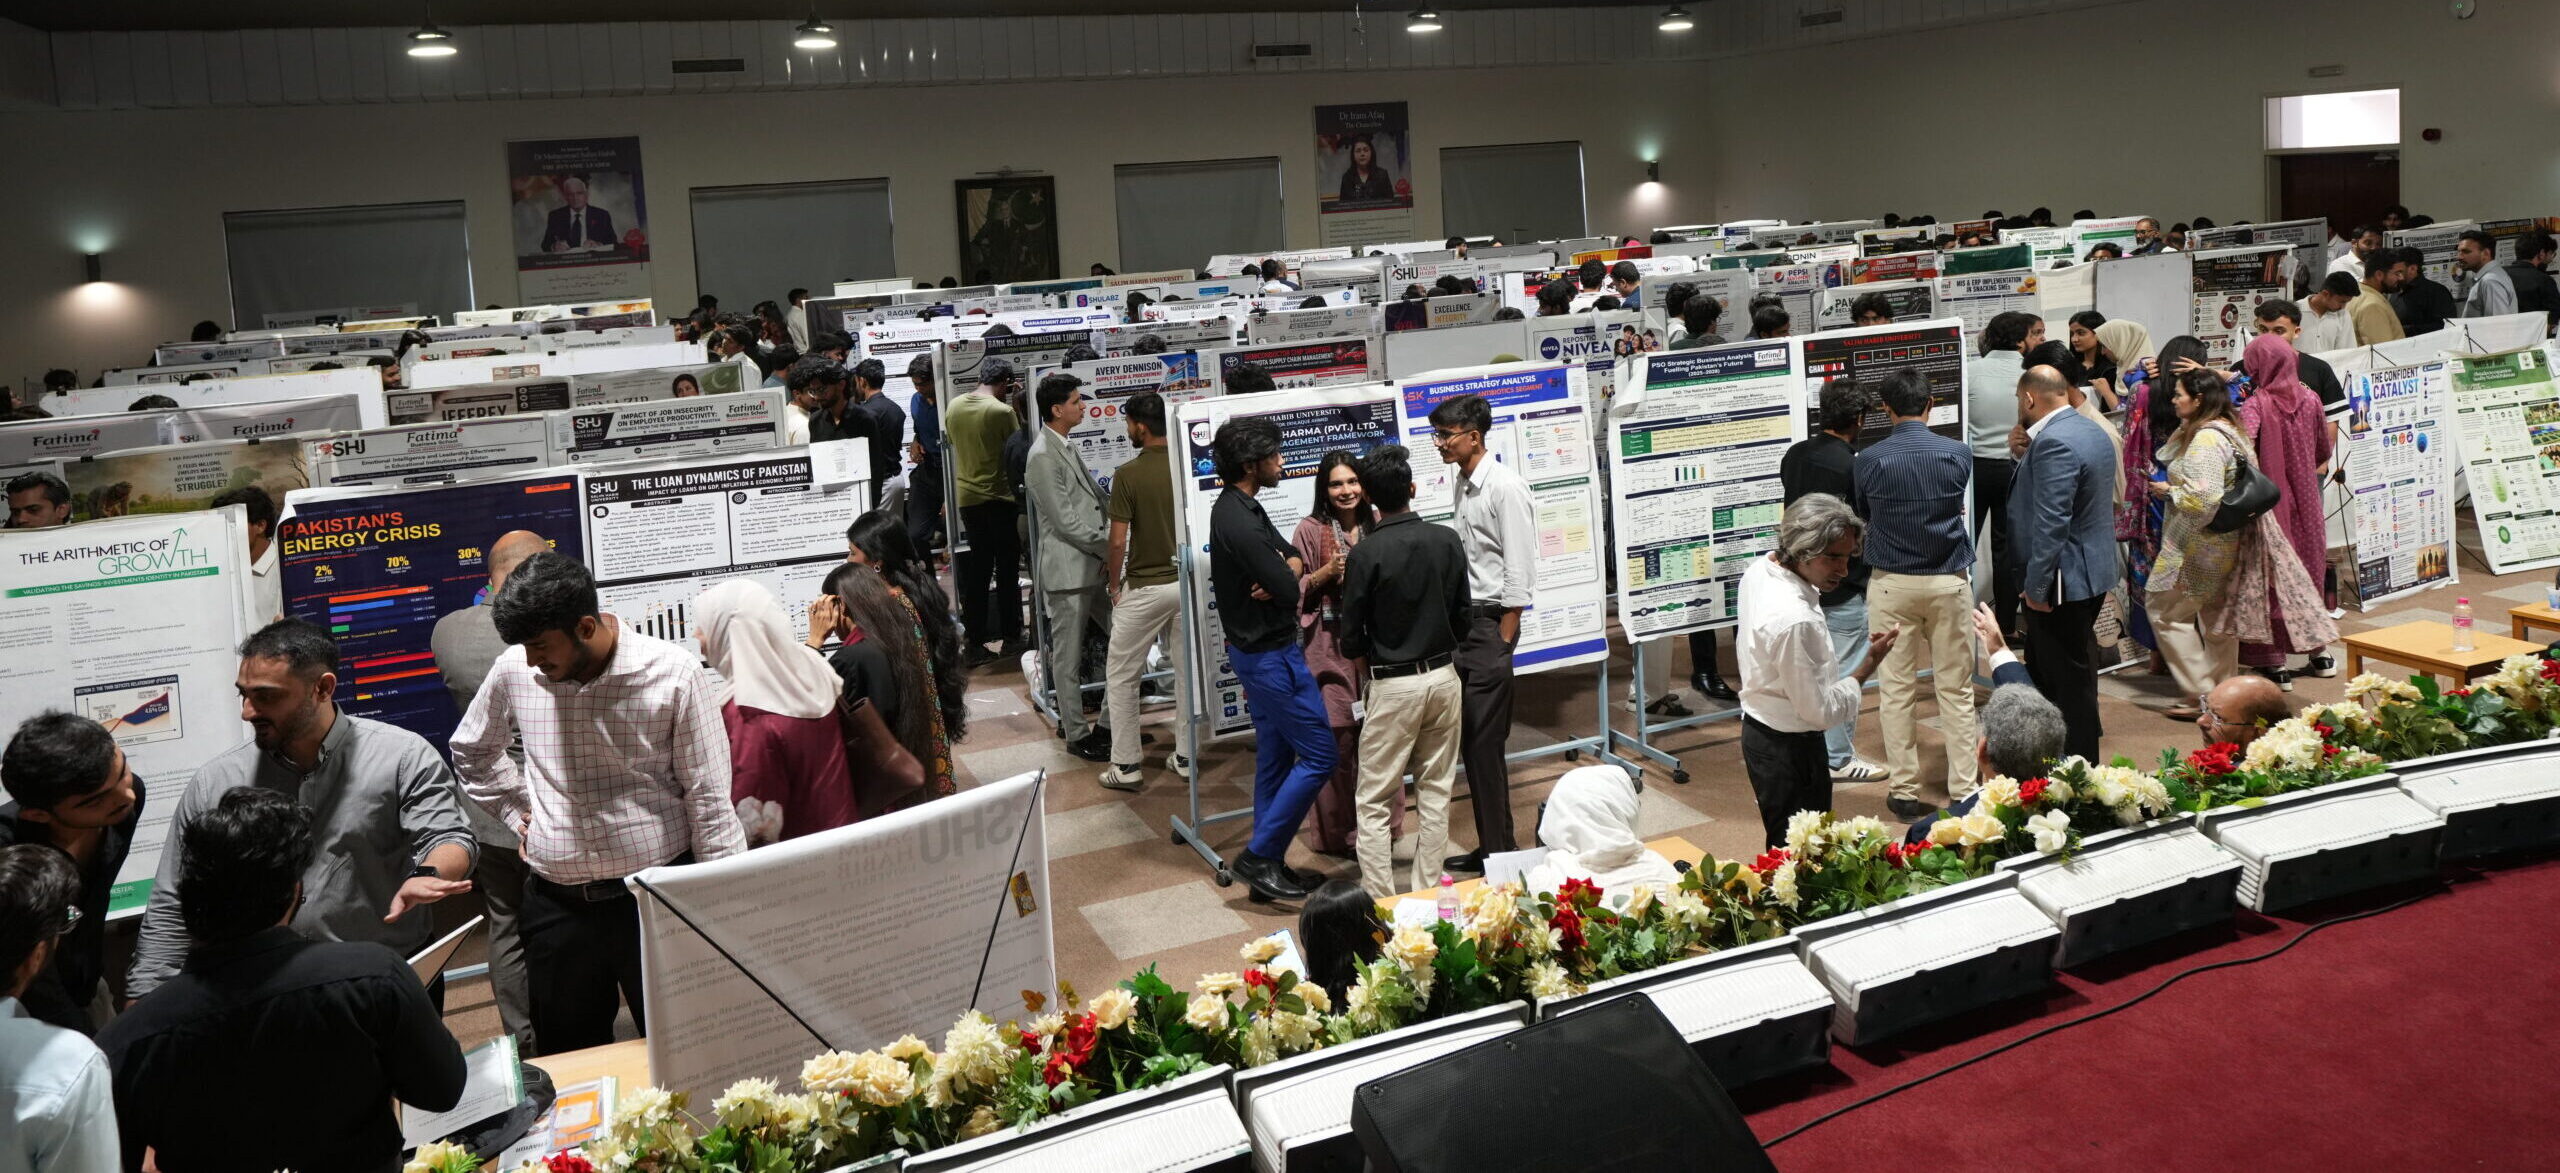
On 4th June, 2026 the Faculty of Management Sciences organized the Spring 2026 Poster Presentation to showcase student projects completed during the semester. Typically, each project is undertaken by a team of four to five students and is linked to a designated organization. In most cases, students receive mentorship and guidance from industry professionals associated with these organizations, strengthening academia-industry collaboration and enhancing the practical relevance of their work.
A total of 232 projects (Annex A) were presented during the event. To ensure an objective and comprehensive assessment, 102 external evaluators from industry and academia evaluated the projects using the following criteria:
- Problem Identification & Relevance
- Quality of Project & Analysis
- Innovation & Practical Application
- Poster Design & Presentation
- Student Understanding & Q&A
Of the total projects, 185 were evaluated digitally through a dedicated QR-code-based system, while the remaining 47 projects were assessed manually. Overall, 591 evaluation records were collected and validated for analysis.
Evaluation
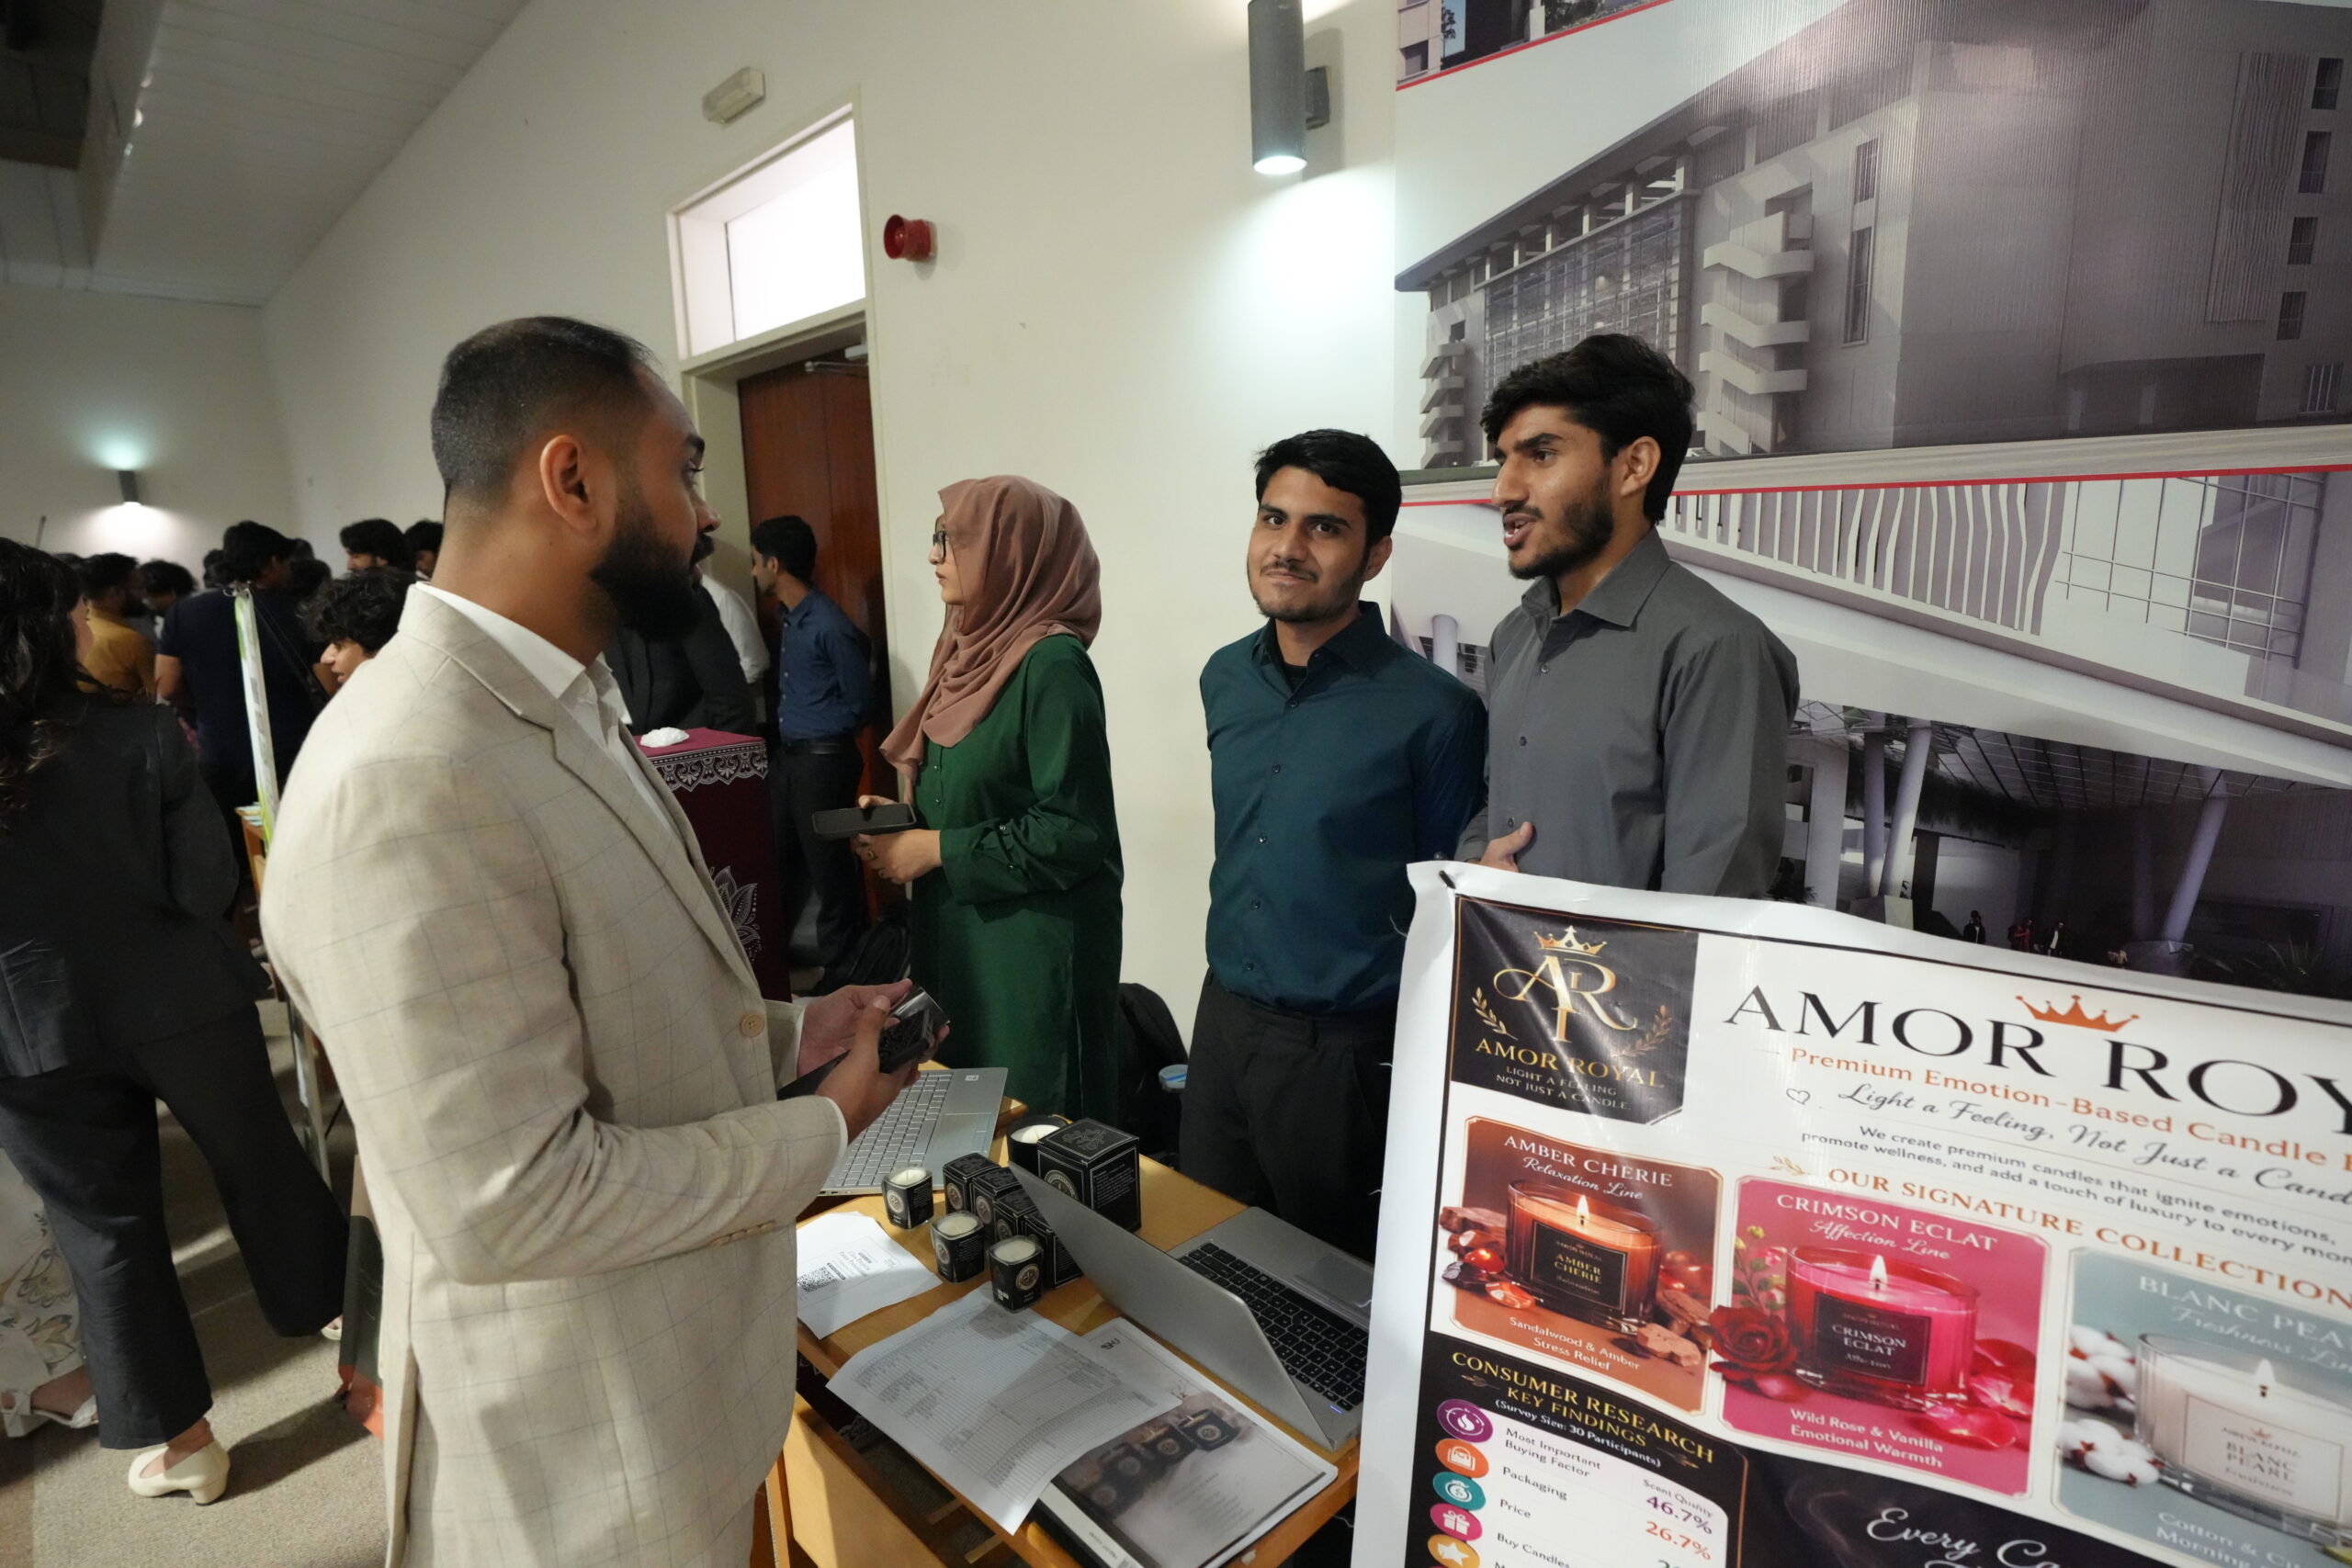
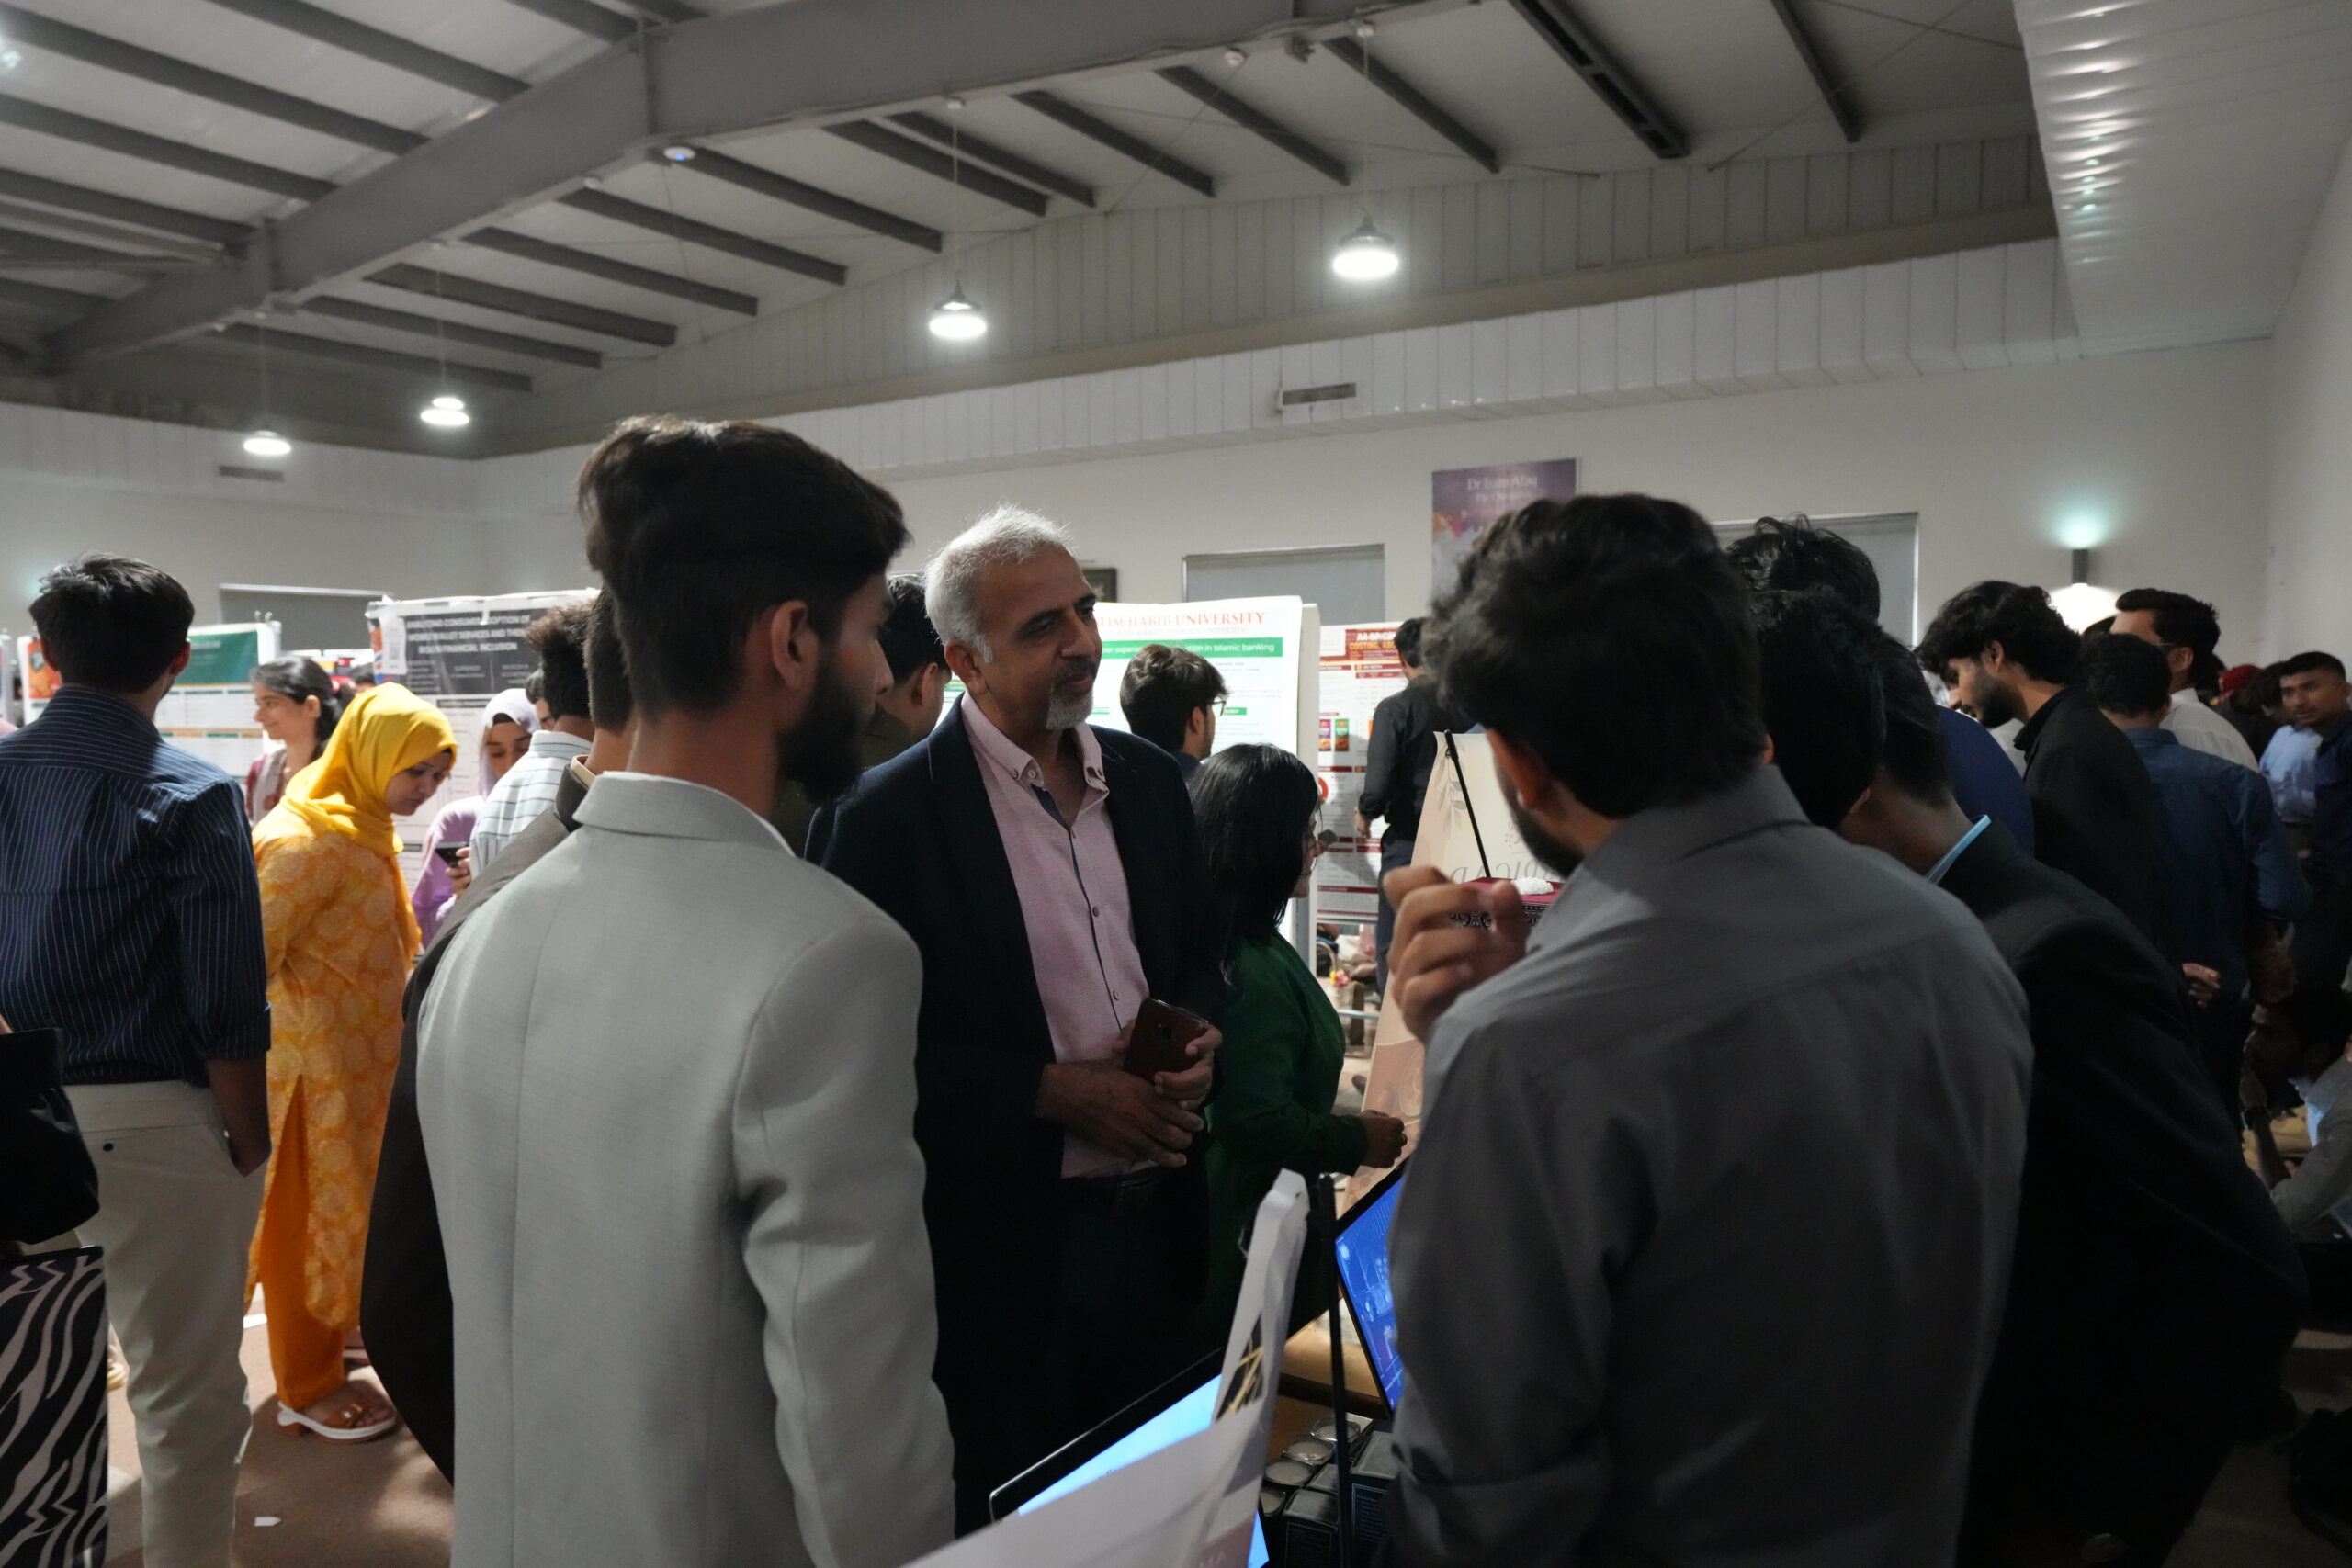
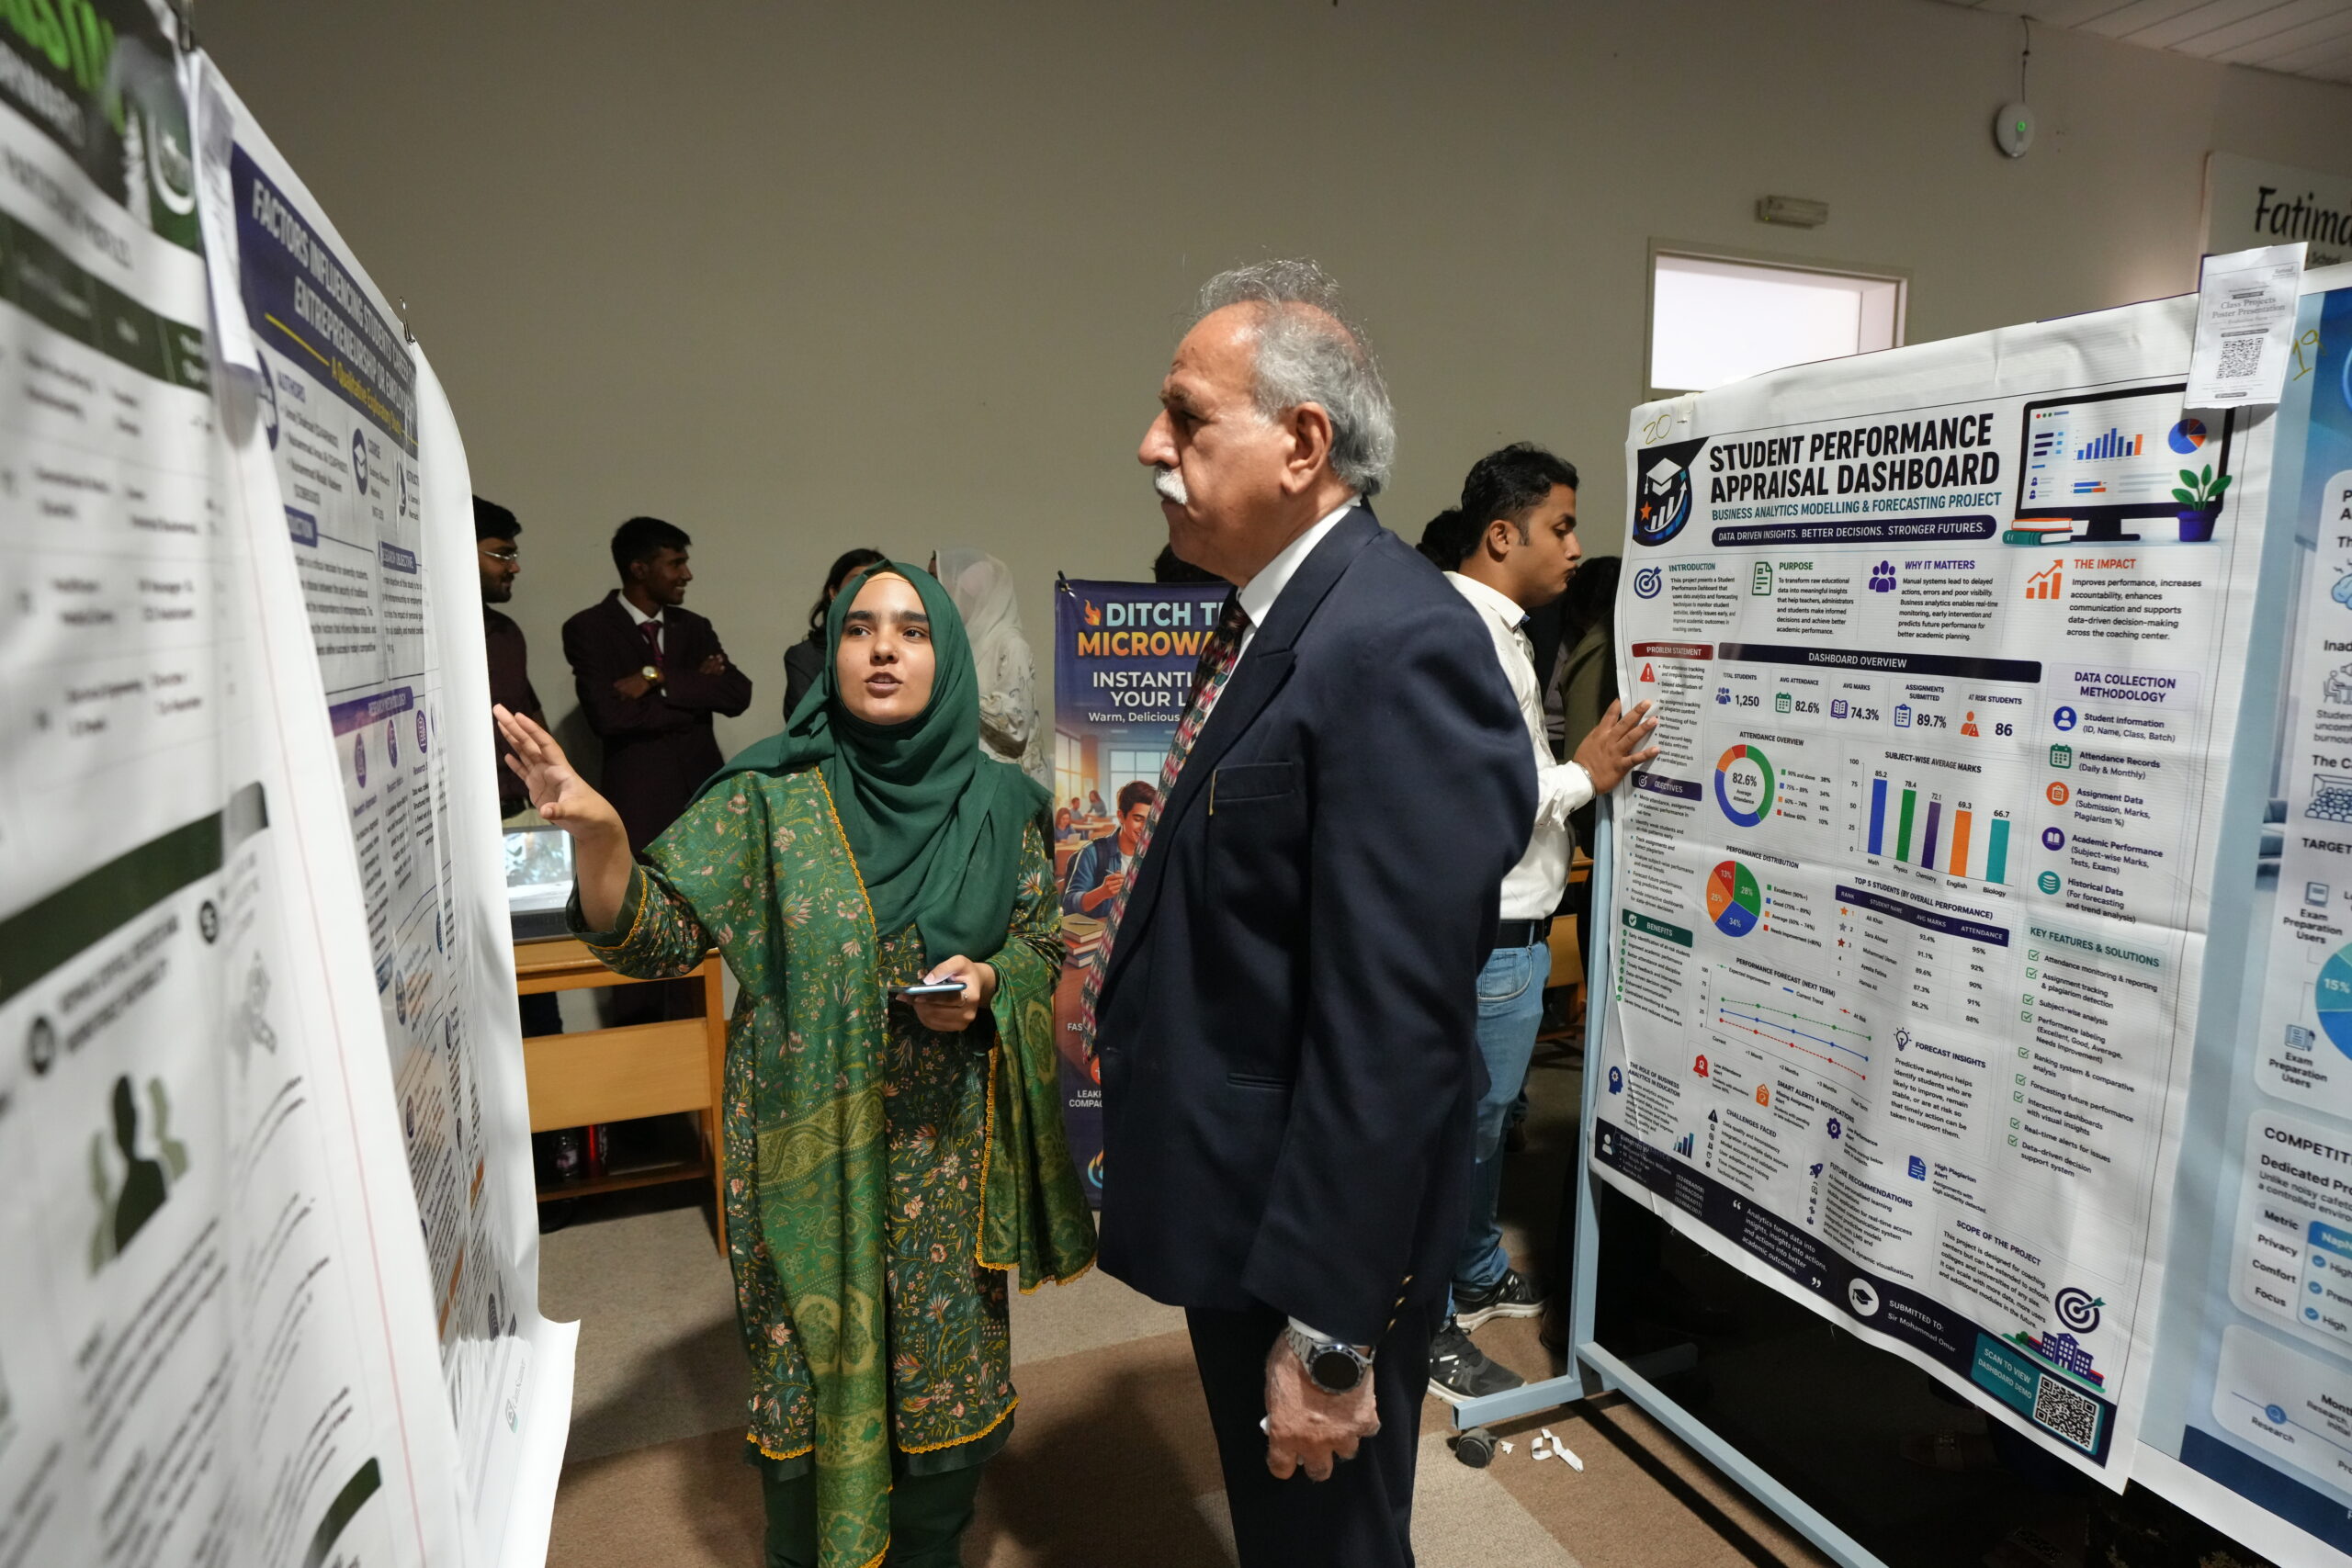
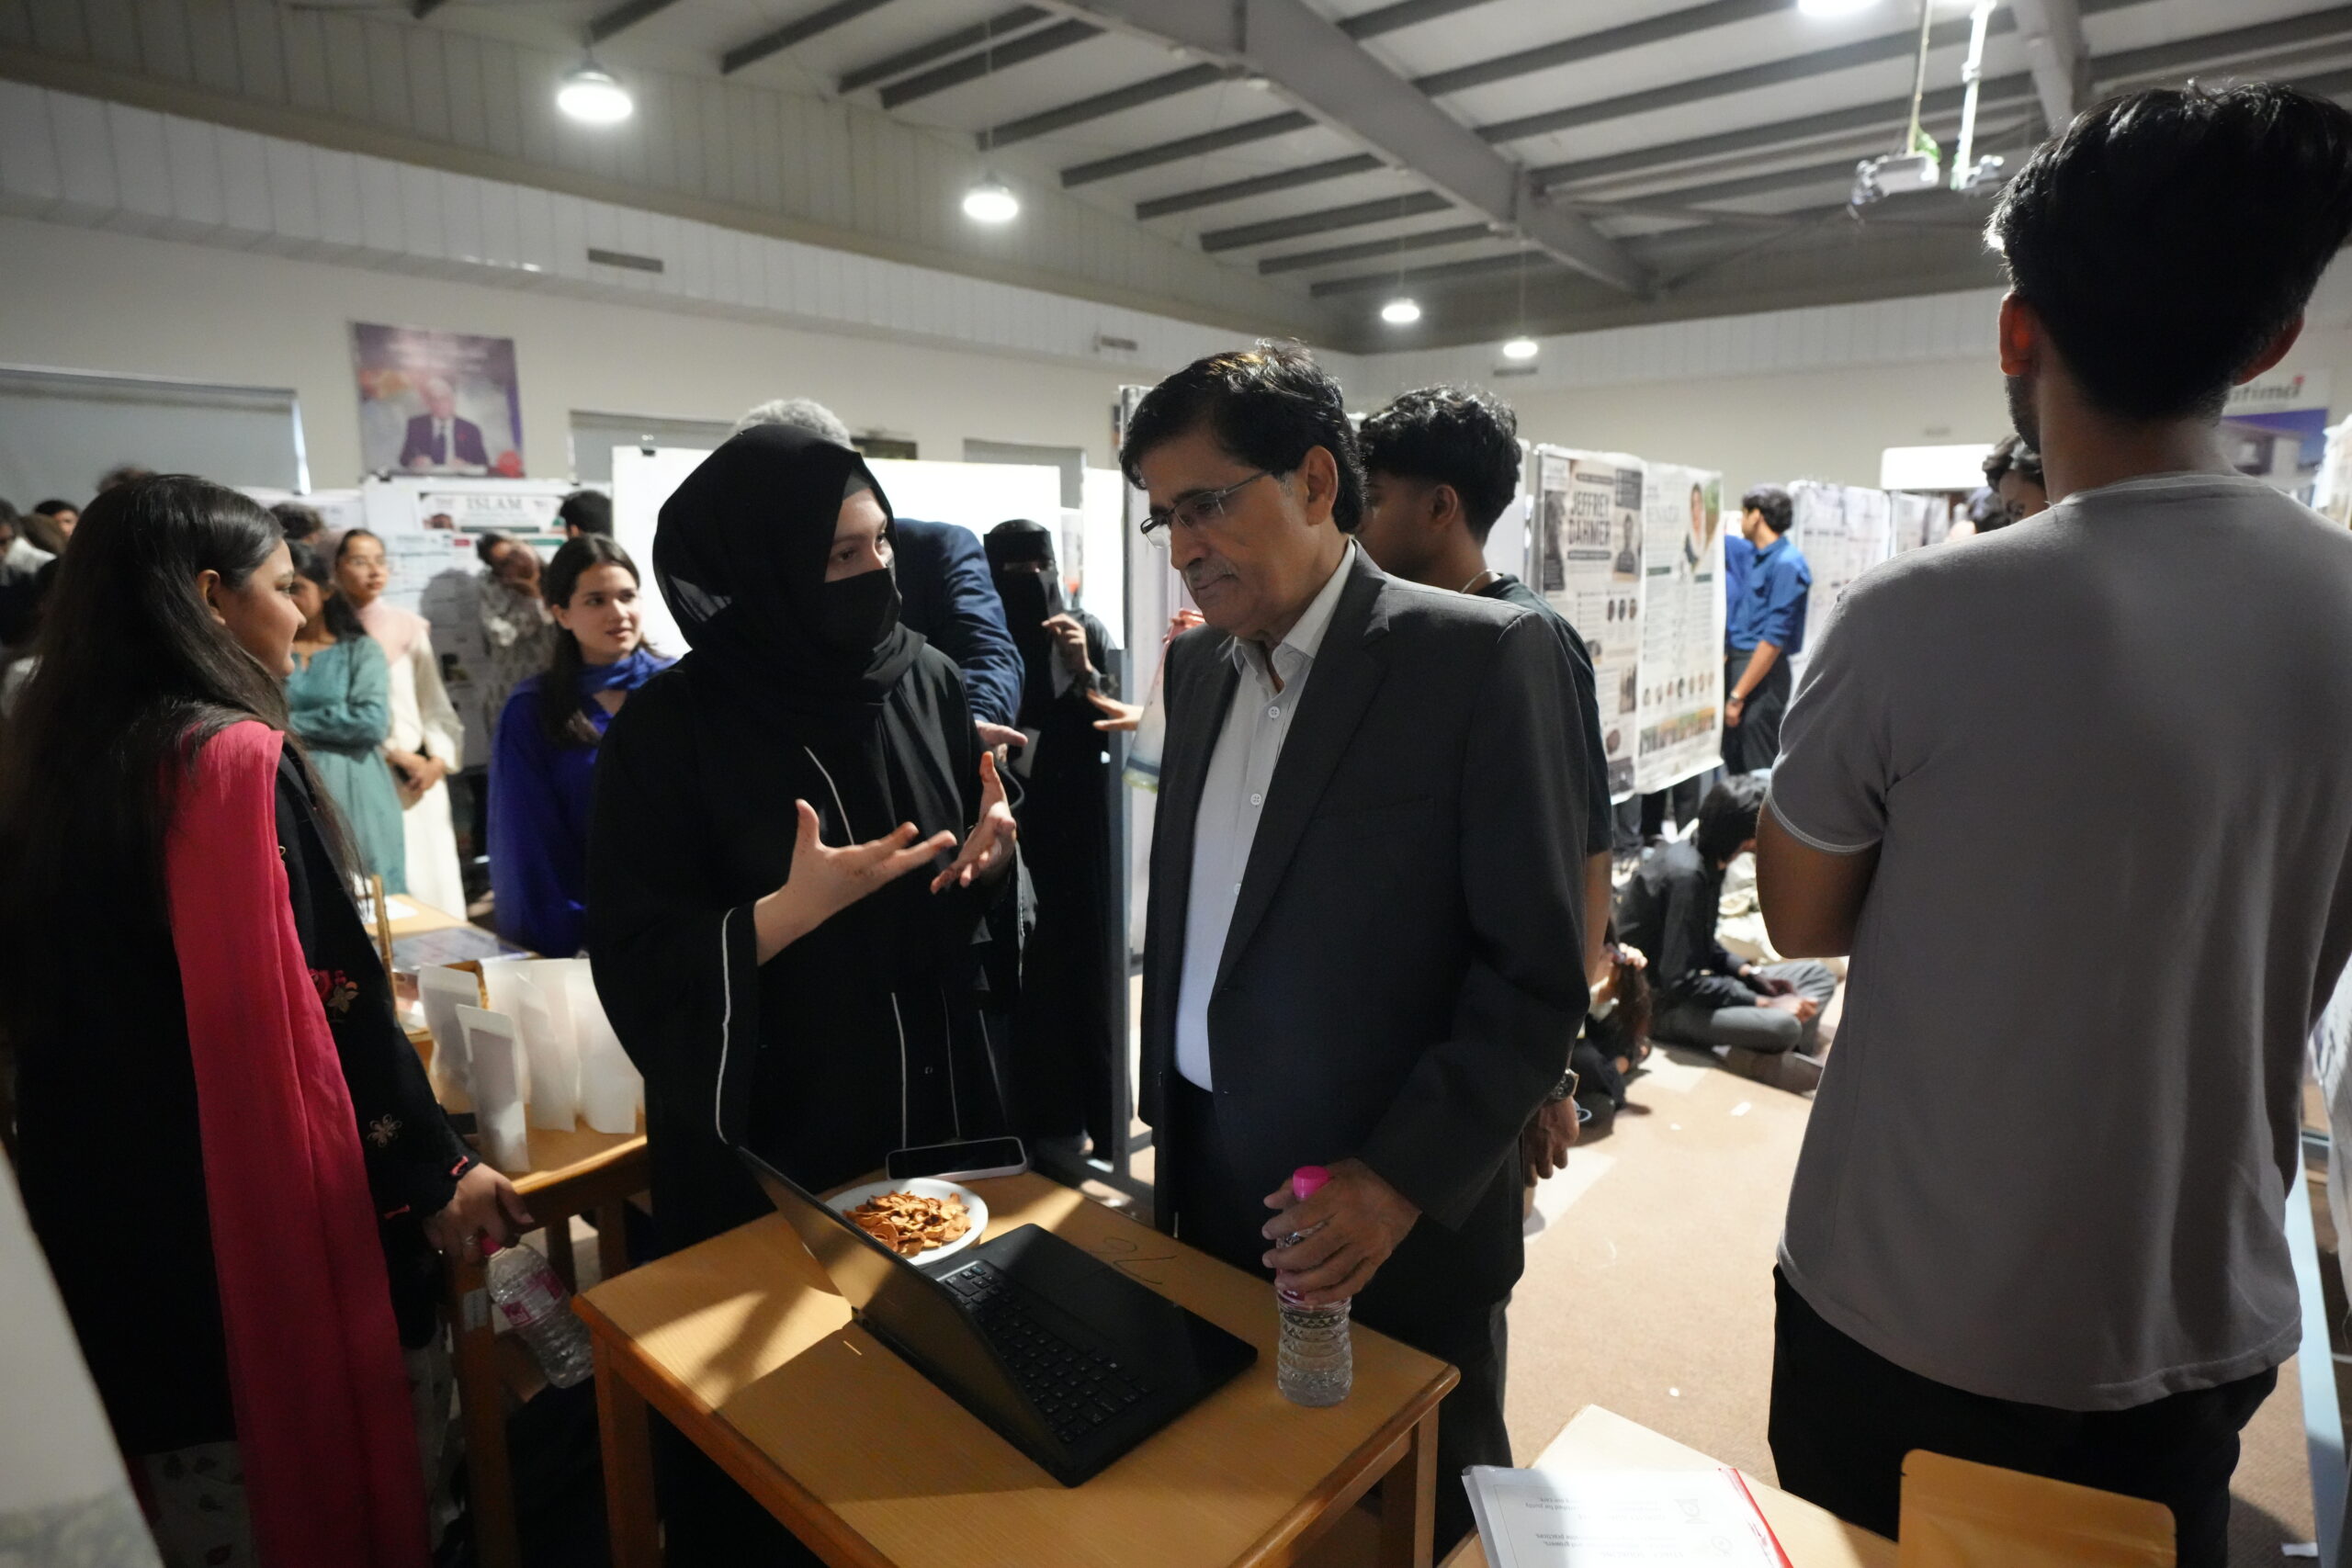
External evaluators from both industry and academia were invited to assess the student projects. A total of 102 evaluators (Annex B) participated in the event, reviewing and evaluating projects aligned with their respective areas of expertise and professional interest. The evaluator panel represented a diverse range of organizations and sectors, including banks, financial institutions, multinational corporations, and leading local enterprises.
Among the participating organizations were renowned international companies such as Mondelez, GSK, Mövenpick, Red Bull, and ALLEZ, as well as prominent local organizations including AKD Securities, Soneri Bank, HBL, Pathfinder Group, J., IBEX, Pakistan State Oil (PSO), and several other Academic Universities. Their participation brought valuable industry perspectives to the evaluation process and provided students with meaningful feedback on the practical relevance, innovation, and potential impact of their projects.
The evaluation results indicate strong overall performance across all assessment dimensions. Student Understanding & Q&A and Poster Design & Presentation emerged as the highest-rated criteria, reflecting the students’ ability to effectively communicate their ideas and demonstrate a sound understanding of their projects.
Innovation & Practical Application recorded the lowest average score among the evaluated dimensions and remains the most significant area for improvement. This finding is understandable, as undergraduate programs often place greater emphasis on conceptual learning and theoretical understanding than on practical implementation and innovation. Nevertheless, the results suggest an opportunity to further strengthen experiential learning, industry engagement, and application-oriented project work.
While average performance was consistently strong, the evaluation also revealed meaningful variation across projects, with some receiving exceptionally high ratings while others performed at an average level.
Average Scores by Evaluation Criterion
| Criterion | Average Score (/5) | Average (%) |
| Problem Identification & Relevance | 4.24 | 84.8% |
| Quality of Project & Analysis | 4.19 | 83.8% |
| Innovation & Practical Application | 4.11 | 82.1% |
| Poster Design & Presentation | 4.27 | 85.3% |
| Student Understanding & Q&A | 4.27 | 85.5% |
Top-Ranked Projects
The chart below presents the highest-ranked projects based on the updated Bayesian-adjusted evaluation model. The displayed scores represent reliability-calibrated project ratings, which account for both average performance and the number of evaluations received. The review count for each project is also provided to enhance transparency and comparability.
Overall Rating Distribution and Review Coverage
The overall distribution of ratings demonstrates a generally high level of project quality, with most projects receiving favorable evaluations across multiple criteria. Review coverage was also well distributed, providing a robust basis for comparative analysis and ranking. The Bayesian-adjusted methodology further enhances reliability by minimizing the influence of projects with limited review counts and ensuring fairer comparisons across all submissions.
Several evaluators expressed highly positive feedback and were particularly impressed by the quality of work demonstrated by the students. They commended the students’ ability to effectively integrate contemporary tools and methodologies into their projects. It was especially encouraging to observe the application of artificial intelligence (AI), sentiment analysis, online dashboards, and data analytics techniques to generate actionable insights and evidence-based recommendations. These projects reflected not only strong conceptual understanding but also the students’ readiness to address real-world business challenges through innovative and data-driven approaches.
Overall, the poster presentation successfully showcased the students’ academic rigor, creativity, and problem-solving capabilities. The active involvement of industry mentors and external evaluators strengthened academia-industry collaboration and provided students with valuable professional exposure. The overwhelmingly positive feedback received from evaluators reaffirms the effectiveness of project-based learning in preparing graduates with the analytical, technical, and managerial competencies required in today’s dynamic business environment.